
FIGURE 4.
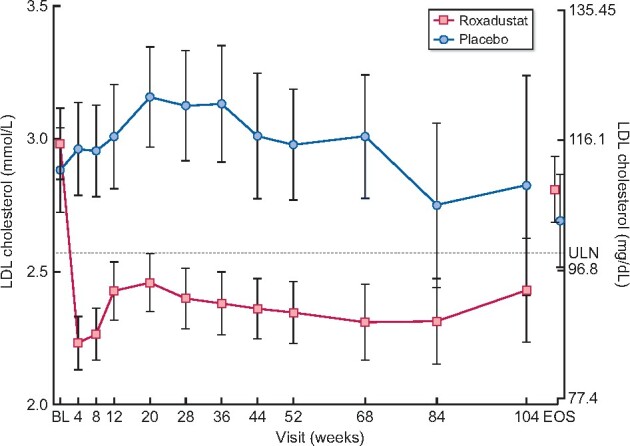
Mean (±95% CI) plot of LDL cholesterol regardless of fasting status by time (FAS). ULN, upper limit of normal.
Official websites use .gov
A
.gov website belongs to an official
government organization in the United States.
Secure .gov websites use HTTPS
A lock (
) or https:// means you've safely
connected to the .gov website. Share sensitive
information only on official, secure websites.
Mean (±95% CI) plot of LDL cholesterol regardless of fasting status by time (FAS). ULN, upper limit of normal.