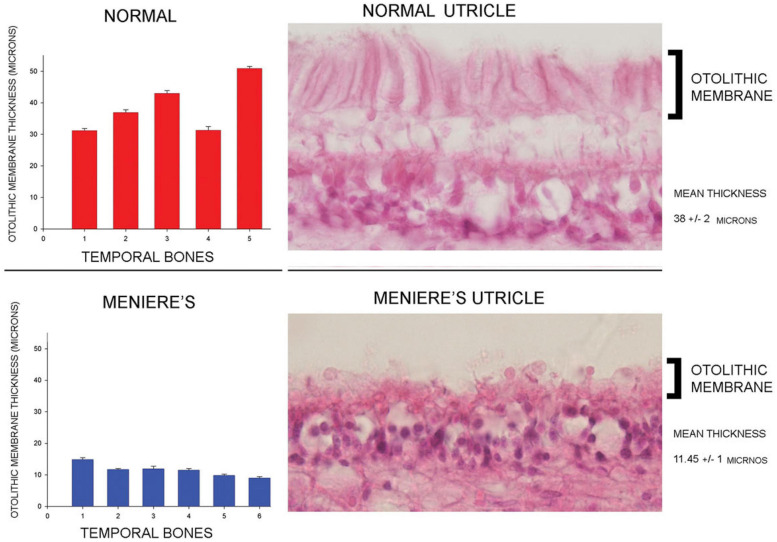
FIGURE 11.
Thickness of the human Otoconial Layer. The Normal Utricle photomicrograph shows otoconial layer thickness values from five specimens; The lower Menière’s utricle showing diseased macula with a much thinner otoconial layer, photomicrograph and OL thickness for six specimens. Reproduced by permission from Ishiyama et al. (2015).

