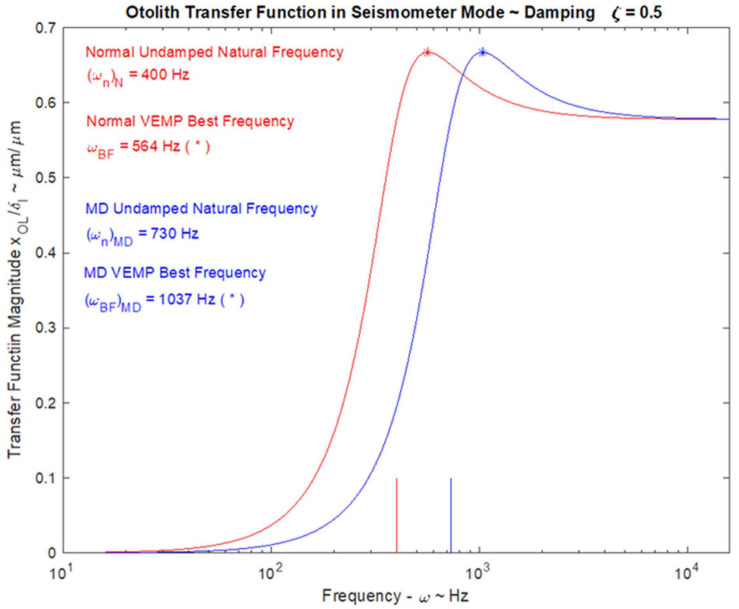
FIGURE 12.
Utricle frequency response (Bode Plot) in Seismometer Mode (shown in red) using estimated UDNF of 400 Hz (shown as vertical red line) and damping ratio of ζ = 0.5 (Dunlap and Grant, 2014). The best test frequency is 564 Hz, shown as red asterisk (*). The frequency response curve for Menière’s Disease (shown in blue) using and estimated UDNF of 730 Hz and with a best frequency of 1037 Hz shown as blue asterisk (*).

