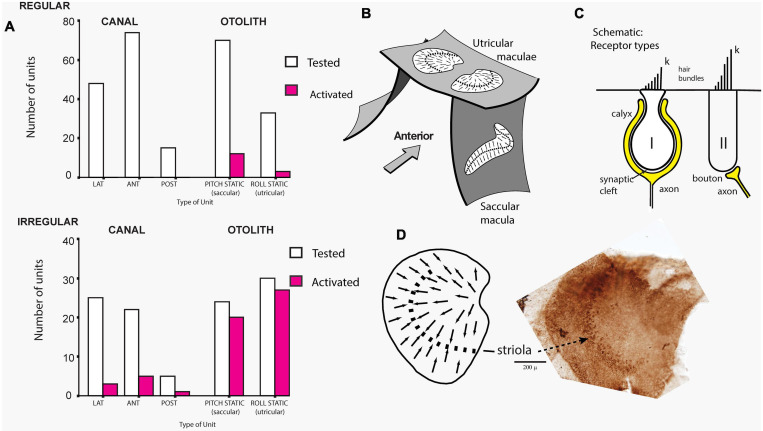
FIGURE 3.
(A) Proportions of primary vestibular afferent neurons tested (open bars) and activated (filled bars) by bone-conducted vibration (BCV) stimuli from each vestibular sensory region. Top chart - Regular neurons, bottom chart irregular neurons. Lat, horizontal canal; Ant, anterior canal; Post, posterior canal. The otolith neurons are divided into Pitch static and Roll static. The results show that only a very small proportion of semicircular canal neurons, or regular otolithic neurons, were activated. However, a large proportion of otolithic irregular neurons were activated. Reproduced, from Curthoys et al. (2006) with permission of Springer. (B) Schematic representation of the plates of otolithic receptors (the utricular and saccular maculae) of the inner ear. The arrows show the preferred polarizations of hair cell receptors across the maculae. The dashed lines are lines of polarity reversal, where the preferred polarizations of receptors reverse. The striola refers to a thin band of receptors on either side of the line of polarity reversal. (C) Schematic representation of type I and type II receptor hair cells and their calyx and bouton afferent terminals. The longest cilium, the kinocilium (k), defines the preferred direction of cell polarization (shown by small arrows in B and D). The type I receptor is enveloped by the calyx afferent ending. (D) Schematic representation of a dorsal view of the whole guinea pig utricular macula. Adjacent to this schematic is a dorsal view of a guinea pig utricular macula treated by calretinin—the band of cells comprising the striola is clearly visible. Reproduced from Curthoys et al. (2012), with permission from Elsevier.

