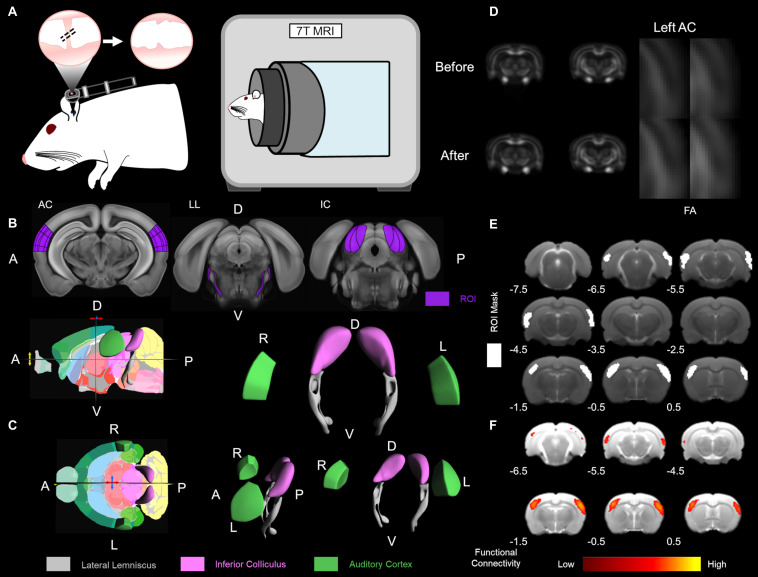
FIGURE 1.
Experimental design and data analysis. (A) The CHL surgery was conducted by tympanic membrane (TM) puncture and malleus displacement. A schematic of the rat ear with the otoscope highlighting the TM is depicted. Hash marks across the malleus indicate displacement and TM puncture with the serrated TM on the right. To the immediate right, the 7 Tesla magnetic resonance imaging (MRI) scanner for rodent structure-functional MRI (PharmaScan, Bruker Biospin). The Allen Mouse Brain Reference Atlas was used for visualization (Lein et al., 2007). (B) The Allen Mouse Brain Reference Atlas average template (Lein et al., 2007) with the region of interest (ROI), in dark purple, from left to right: AC 80 image, LL 96 image, and IC 101 image. (C) The Allen Mouse Brain Atlas 3D rendering a cutaway of the longitudinal/sagittal plane (top) and horizontal/transverse plane (bottom) with the 2D coronal reference atlas (Lein et al., 2007). The Allen Mouse Brain Atlas 3D volumetric rendering tilted in the horizontal plane rotated left 5° (top), tilted in the horizontal plane rotated left 20° (bottom), and tilted in the horizontal plane rotated left 90° (bottom left), all in the y-axis translation. Volumetric ROI are color-coded lateral lemniscus in gray, inferior colliculus (IC) in light purple (lavender) and auditory cortex in green. R – right, L – left, D – dorsal, V – ventral, A – anterior, P – posterior. (D) Diffusion tensor imaging (DTI) fractional anisotropy (FA) of the before and 1 week after CHL timepoints. The left auditory cortex (AC) is highlighted in the zoomed insert. (E) The ROI for masks used for functional connectivity are delineated in white. Bregma coordinates (in mm) are below the brain. (F) Functional connectivity maps using a color bar depicted from the correlation coefficient and z-score.

