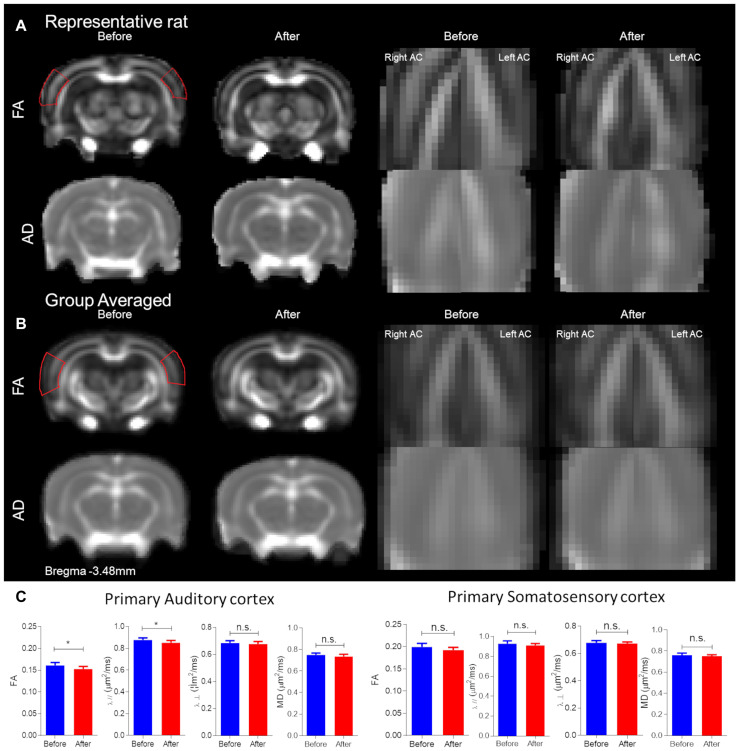
FIGURE 3.
Structural alterations underlying conductive hearing loss assessed by DTI ROIs. The panel is segregated into before and after CHL for Bregma –3.48 mm. (A) Representative rat FA maps (first row of brains from left) and AD maps (second row of brains from left) from individual CHL rats. (B) Group-averaged FA (first row of brains from left) and AD (second row of brains from left) maps for CHL. Note the red outline for FA represents the approximate ROI for measures. (C) Bar plots of DTI measures for the primary auditory cortex and somatosensory cortex: FA, MD, RD (λ⊥), and AD (λ//) for before (blue) and after (red) CHL with standard deviation. The mean FA and AD after CHL were significantly decreased compared to before, T-test: t = 2.769, df = 12, p = 0.0143 and t = 2.474, df = 15, and p = 0.0258, respectively. The asterisk (*) indicates significant p < 0.05.

