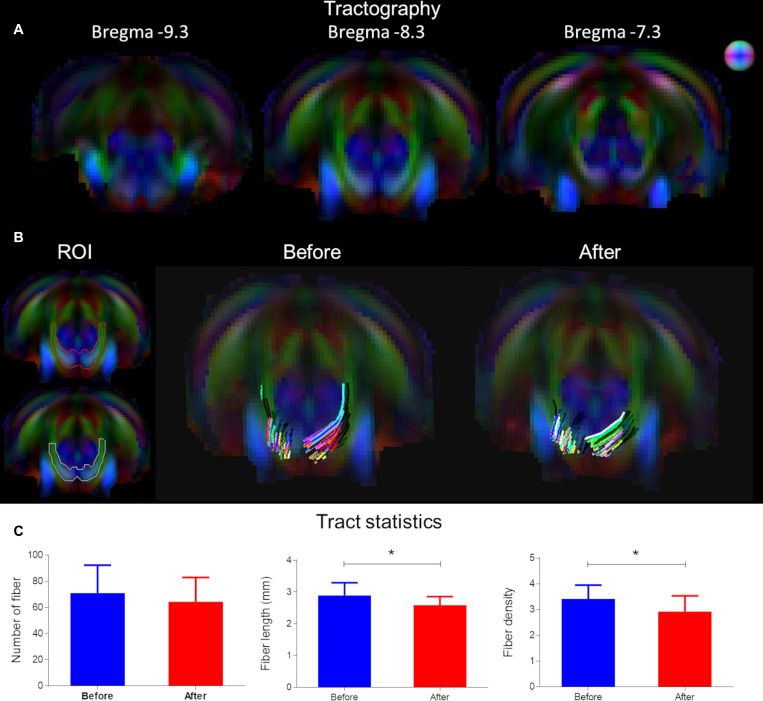
FIGURE 4.
Tract alterations underlying conductive hearing loss assessed by tractography. (A) Tractography was used to delineate the ventral aspect of lateral lemniscus on Bregma –7.5, –8.6, and –9.7 mm. The color map shows the primary eigenvector in the region of the ventral lateral lemniscus traversing upward in the ventral-dorsal direction. (B) The tractography panel ROI demonstrates the fibers originate from a ventral position and course upward dorsally in a bilaterally symmetrical fashion. (C) Bar plots of tract metrics in the ROI for the lateral lemniscus. The mean fiber number was insignificantly different after CHL; however, the mean fiber length and mean fiber density for the lateral lemniscus after CHL was significantly decreased compared to before (t-test: t = 2.548, df = 30, p = 0.0162 and t = 2.388, df = 30, and p = 0.0234, respectively).

