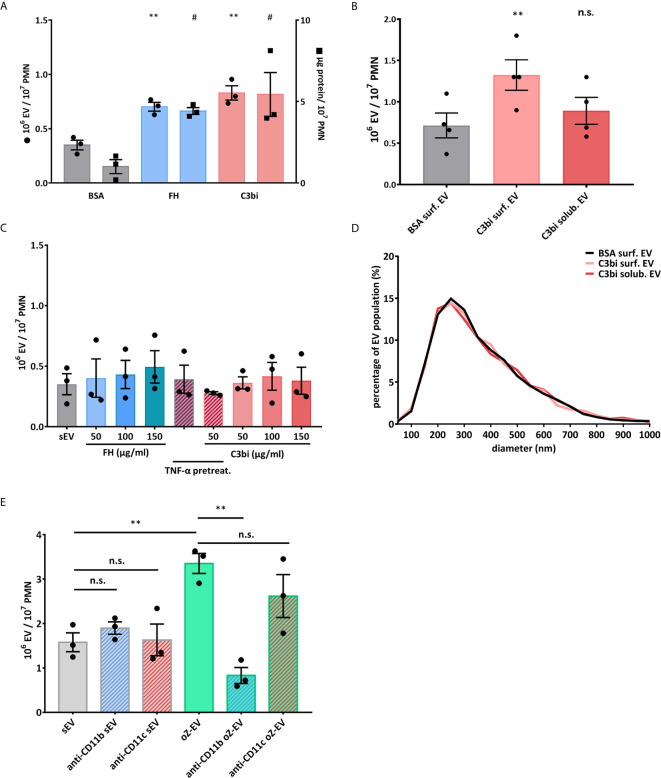
Figure 1.
Mac-1 ligand surface induces EV production from adherent PMNs. (A) Comparison of EV production of adherent PMNs on BSA and surface-bound Mac-1 ligands. Dot scatter bars represent the EV quantification by flow cytometry, square scatter bars represent the quantification based on protein amount measurement. The EV production was measured on BSA surface (20 µg/ml), on C3bi surface (50 µg/ml) and on FH surface (50 µg/ml) for 20 minutes. N=3, error bars represent mean ± S.E.M. Data were compared to BSA by using RM one-way ANOVA coupled with Dunett’s post hoc test. (B) Comparison of the concentration of EV samples generated by adherent and soluble PMNs measured by NTA. C3bi (50 µg/ml) and BSA (20 µg/ml) were used in the previously detailed concentration. N=3, error bars represent mean ± S.E.M. Data were compared to BSA surface by using RM one-way ANOVA coupled with Dunett’s multiple comparisons test. (C) Comparison of EV production of PMNs induced by soluble Mac-1 ligands in different concentrations. The quantification of the EVs was carried out by flow cytometry. N=3, error bars represent mean ± S.E.M. Data were compared to spontaneous EV production (sEV) by using RM one-way ANOVA coupled with Dunett’s post hoc test. (D) Representative diagram of size distribution of PMN EVs induced by soluble or surface-bound C3bi measured by NTA. (E) Spontaneous and opsonized zymosan induced EV production of suspended PMNs in the presence of anti-CD11b (clone: ICRF44) and anti-CD11c (clone: 3.9) inhibitory antibodies. The quantification of the EVs was carried out by flow cytometry, EVs were labelled with FITC-Annexin V. N=3, error bars represent mean ± S.E.M. Data were compared by using RM one-way ANOVA coupled with Sidak’s multiple comparison test. #P < 0.05 and **P < 0.01; n.s., non significant.

