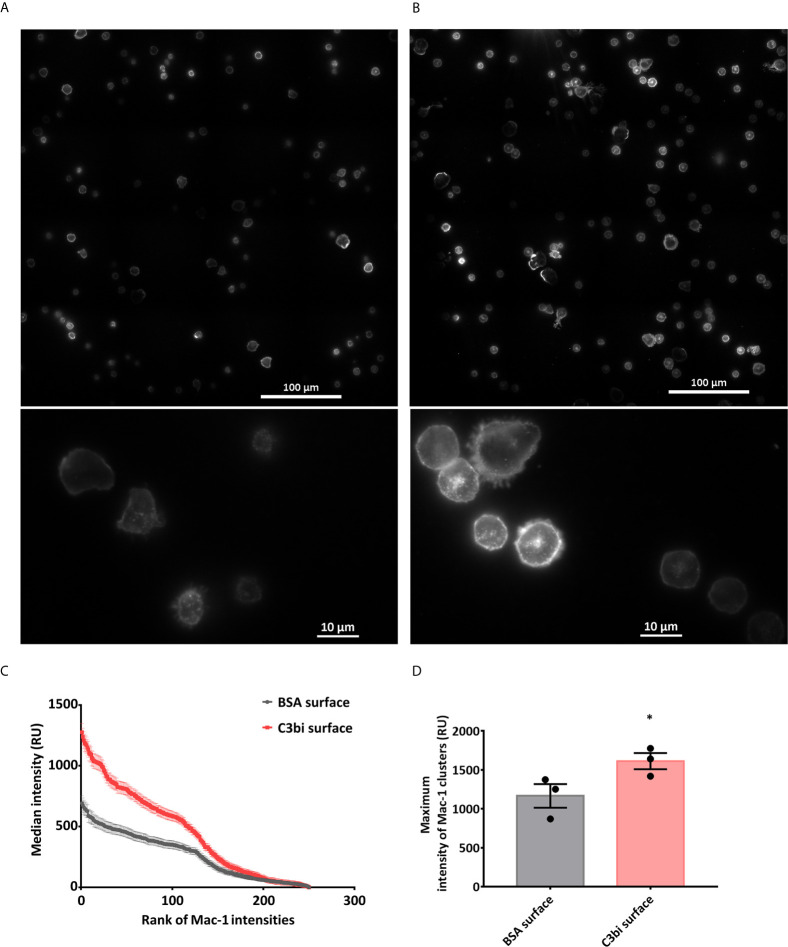
Figure 2.
Mac-1 receptor clustering on BSA and C3bi surface. (A, B) Representative TIRF microscopic images of the cells after 20 minutes on coated surfaces. Cells were labelled with Alexa647-conjugated anti-CD11b. (A) BSA-coated surface, (B) C3bi-coated surface captured at the 20th minute time point. (C) Median fluorescence intensity values of the ranked intensities of all the cells measured along a standard 25 μm line. Three independent experiments. Error bars represent mean ± S.E.M. Data were compared by linear regression. The two datasets are significantly different (p<0.0001). (D) Median of peak intensity values of the clusters in the samples. Three independent experiments, error bars represent mean ± S.E.M. Data were compared by using Students’s t-test. *P < 0.05.

