Figure 4.
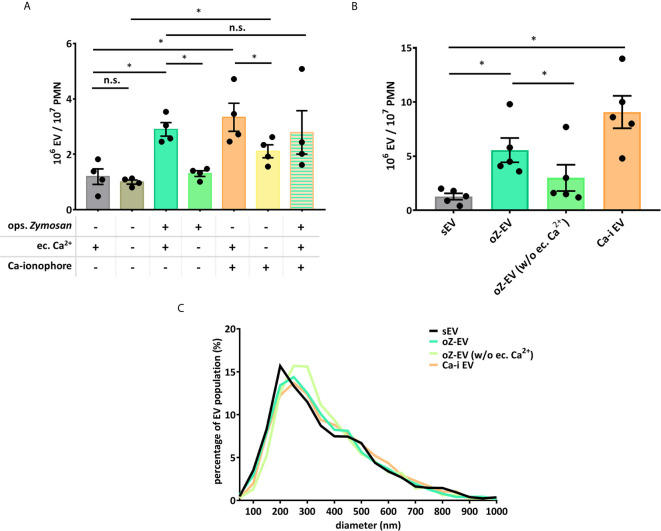
Role of the Ca2+ supply in the PMNs’ EV production. (A) Comparison of EV production of PMNs quantified by flow cytometry. Dependence on Ca2+ supply was tested by omitting Ca2+ from the incubation medium or by addition of A23187 Ca-ionophore. N=4, error bars represent mean ± S.E.M. Data were compared by using RM one-way ANOVA coupled with Sidak’s post hoc test. (B) Comparison of the concentration of the differently induced PMN EVs, measured by NTA. N=3, error bars represent mean ± S.E.M. Data were compared by using RM one-way ANOVA coupled with Sidak’s multiple comparisons test. “Ca-I EV” signifies EVs produced in the presence of Ca-ionophore and extracellular calcium. (C) Representative diagram of size distribution of PMN EVs produced in different conditions measured by NTA. *P < 0.05; n.s., non significant.

