
Figure 3.
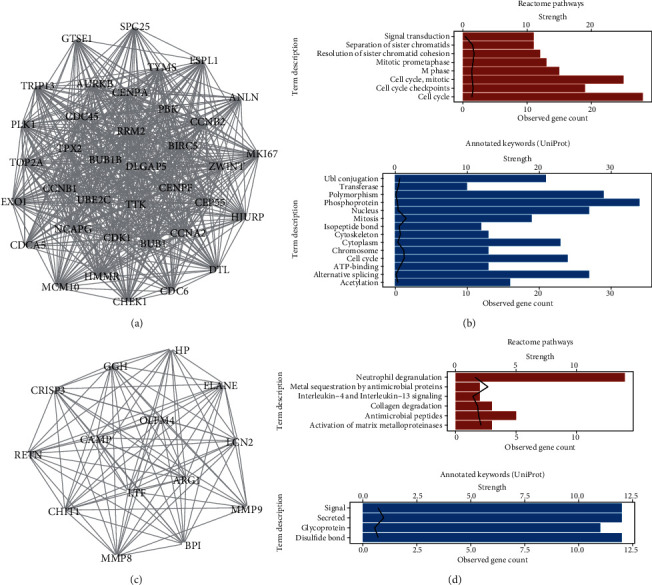
Protein-protein interaction (PPI) network for the DEGs. (a) Cluster 1 (score = 34.3, node = 37, and edge = 618) detected by molecular complex detection (MCODE) of Cytoscape. (b) Reactome pathway enrichment and UniProt database annotation for the genes in cluster1; line represented strength value. (c) Cluster2 (score = 13.5, node = 14, edge = 88) identified by MCODE. (c) Reactome pathway enrichment and UniProt database annotation for the genes in cluster2.