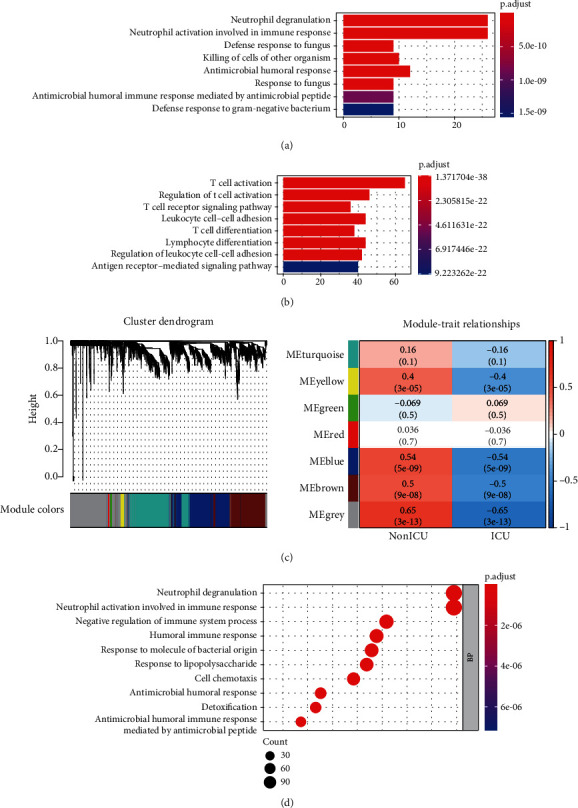
Figure 5.

Relationship between transcriptomic alternations with severity of patients. (a) Biological process (BP) of GO analysis for genes upregulated (n = 67) in ICU patients compared to non-ICU patients in GSE157103. (b) BP of GO analysis for genes downregulated (n = 309) in the ICU patients. (c) Modules clustering and their relationship with clinical traits in WGCNA. (d) BP of GO analyses for genes in the grey module.
