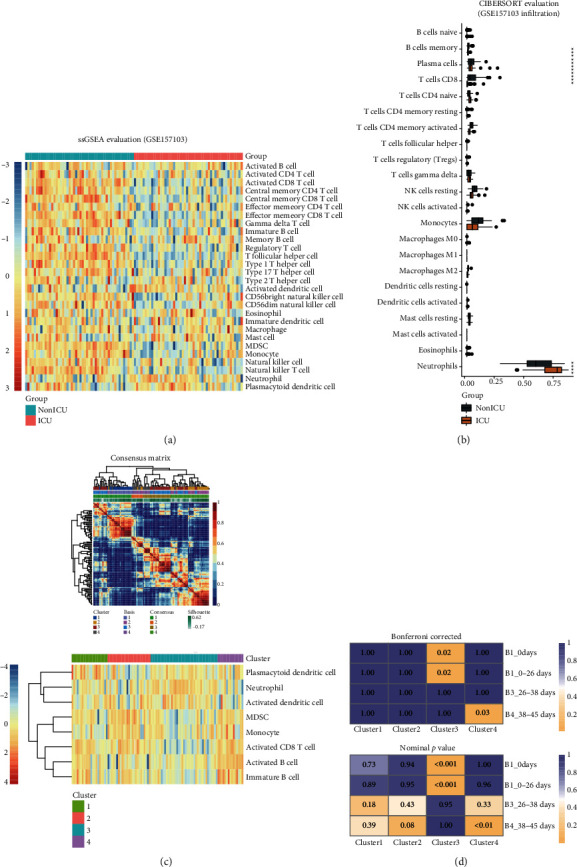
Figure 7.

Difference of immune cell abundance between ICU patients and non-ICU patients and immune subtypes. (a) ssGSEA for evaluation of 28 immune cell infiltration in GSE157103. (b) CIBERSORT for evaluation of 22 immune cell infiltration in GSE157103. (c) 4 clusters were identified in the NMF clustering using the ssGSEA result. (d) Bonferroni-corrected and nominal p value of the submap result.
