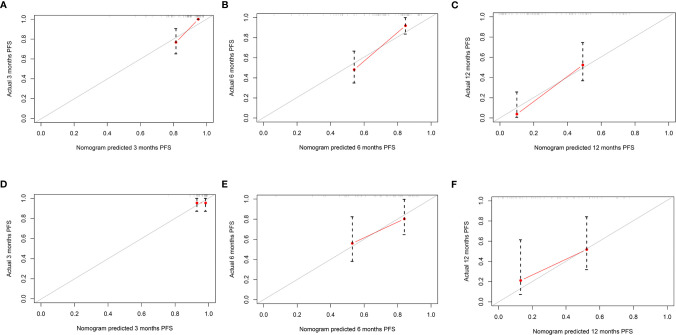
Figure 5.
The calibration curves of the nomogram for predicting progression-free survival (PFS) in both the training and validation cohorts. The x-axis represents the nomogram predicted probability, and the y-axis represents the actual probability of PFS. The red line indicates the performance of the nomogram, of which a closer fit to the gray line represents a better prediction. Calibration curves of the nomogram for predicting PFS at (A) 3, (B) 6, and (C) 12 months in the training cohort. Calibration curves of the nomogram to predict PFS at (D) 3, (E) 6, and (F) 12 months in the validation cohort.

