Figure 2.

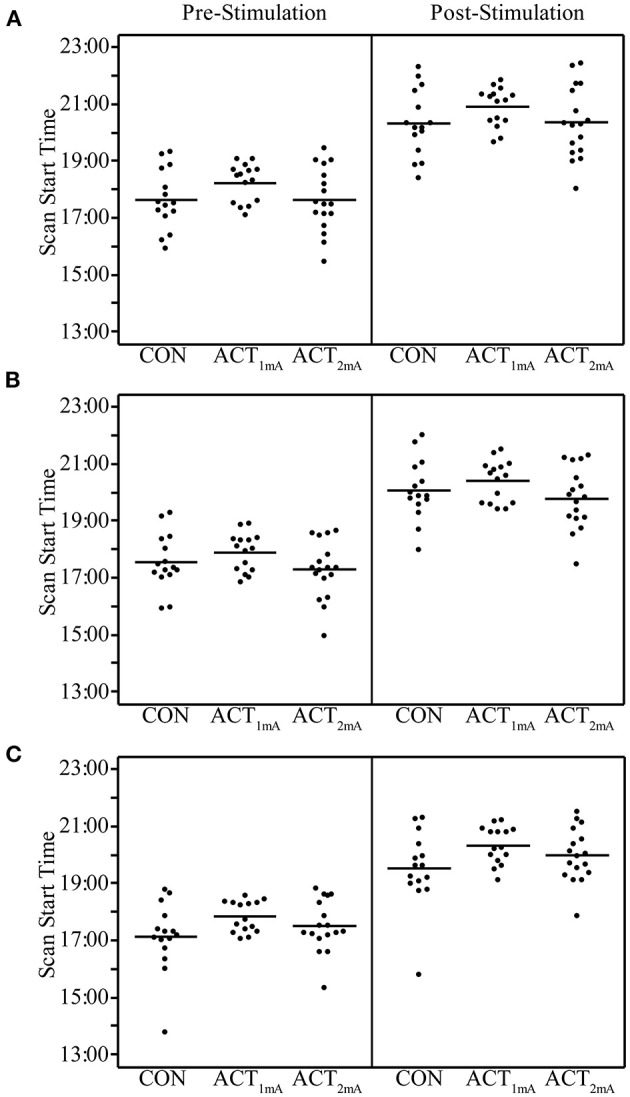
Pre- and post-stimulation scan start times for session 1 (A), session 2 (B), and session 3 (C) separated by group. Group averages are indicated by the bar.

Pre- and post-stimulation scan start times for session 1 (A), session 2 (B), and session 3 (C) separated by group. Group averages are indicated by the bar.