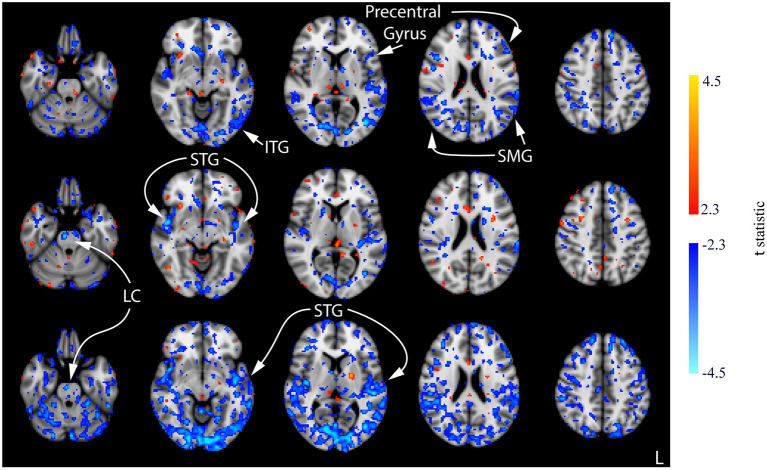
Figure 7.
Results of the one-way ANOVA for the CON group displayed through post-hoc, pairwise comparisons between session 1 pre-stimulation and session 1 post-stimulation (top row), session 2 post-stimulation (middle row), and session 3 post-stimulation (bottom row). Corresponding images demonstrating the magnitude of CBF changes are given in Supplementary Figure 3. Axial slices are taken from MNI coordinates z = −26, −8, 6, 22, and 44 mm (left to right).

