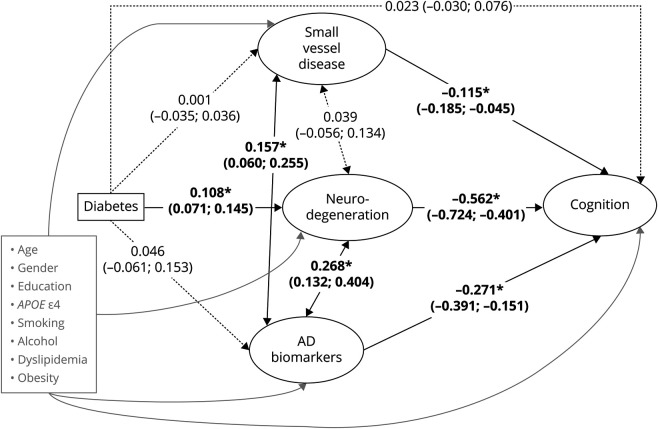
Figure. Structural Equation Model for the Association Between Diabetes, Small Vessel Disease, Neurodegeneration, Alzheimer Disease (AD) Biomarkers, and Cognition.
Latent variables of interest are indicated in ovals and observed variables in rectangles. Directed arrows represent linear regressions. Bidirectional arrows represent correlations. Standardized regression coefficient estimates are presented with their 95% confidence interval. Solid lines indicate statistically significant associations and correlations at the 5% level. Dotted lines indicate non–statistically significant associations and correlations at the 5% level. Adjustment covariates and their directed arrows to small vessel disease, neurodegeneration, AD biomarkers, and cognition are represented in gray. For readiness, the observed indicators defining each latent variable (listed in Table 1) and residual variances for all variables were omitted. *p < 0.001.

