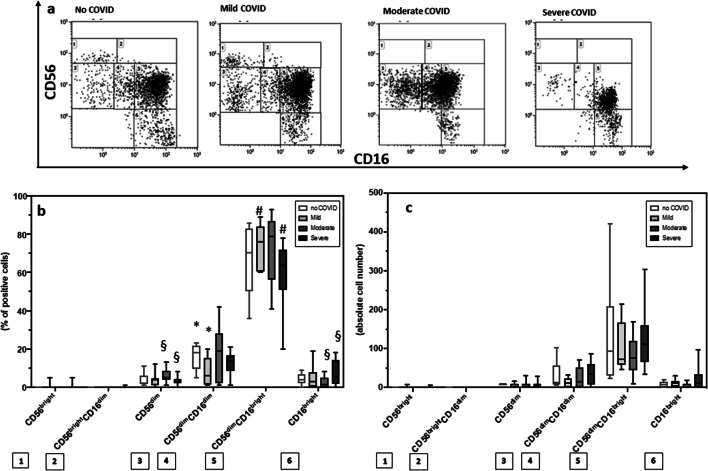
Fig. 2.
COVID-19 is associated with dysregulated NK cell subsets. (a) CD56 vs CD16 dot plot identifying natural killer cell subsets. Summary results of median percentage (b) and of absolute numbers (c) of NK subsets relative to total NK population in SARS-CoV-2-uninfected healthy controls (white bar) and in convalescent COVID-19 patients who suffered from mild (light gray bar), moderate (gray bar), or severe (black bar) disease are shown. The boxes stretch from the 25th to the 75th percentile. The lines across the boxes indicate the median values. The lines stretching from the boxes indicate extreme values. Statistical significance is shown: *comparisons mild vs no COVID; #comparisons mild vs severe; §comparisons moderate vs severe

