Figure 3.
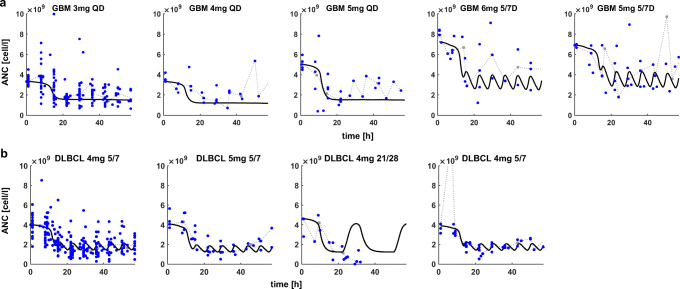
Clinical measures of ANC (blue dots, individual (processed) clinical ANC; gray-dotted line, clinical ANC median profile) for GBM and DLBCL dose groups. Post-avadomide administration, ANC level are quite stable for the measures at day 1 and 8, followed by a drop at day 15, with nadir typically observed at day 22. a Model best-fit (black-solid line) to ANC data for all GBM dose groups; b model best-fit to ANC data for multiple DLBCL dose groups. Schedules: QD, daily dosing; 5/7, 5 days on, 2 days off; 21/28, 21 days on, 7 days off

