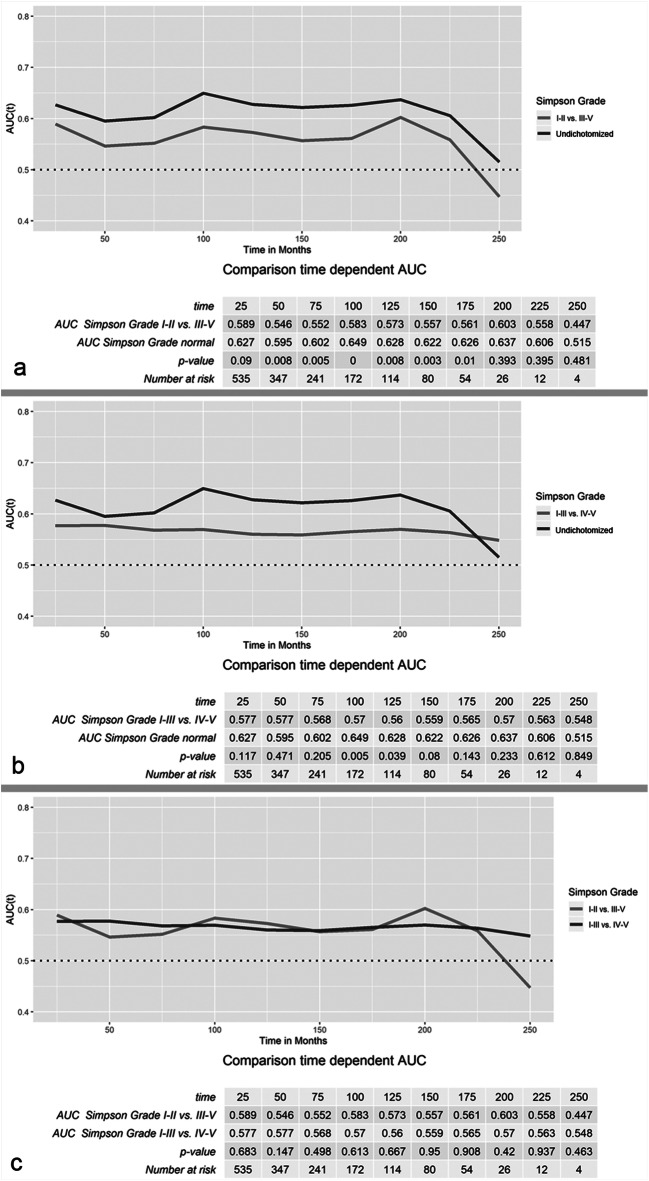
Fig. 3.
Time-dependent ROC analyses of the predictive value of different systems of classification of the extent of resection. In a, the course of the AUC values of the dichotomized extent of resection (Simpson grade I–II vs ≥ III) and the undichotomized Simpson grading runs almost in parallel. However, AUC values of the dichotomized scale are significantly lower up to 175 months (p < .05). In contrast, AUV values after dichotomization into Simpson grade I–III vs ≥ IV resections differed less significantly (b). However, in direct comparison, AUC values of both dichotomization scales did not significantly differ during the entire observation period

