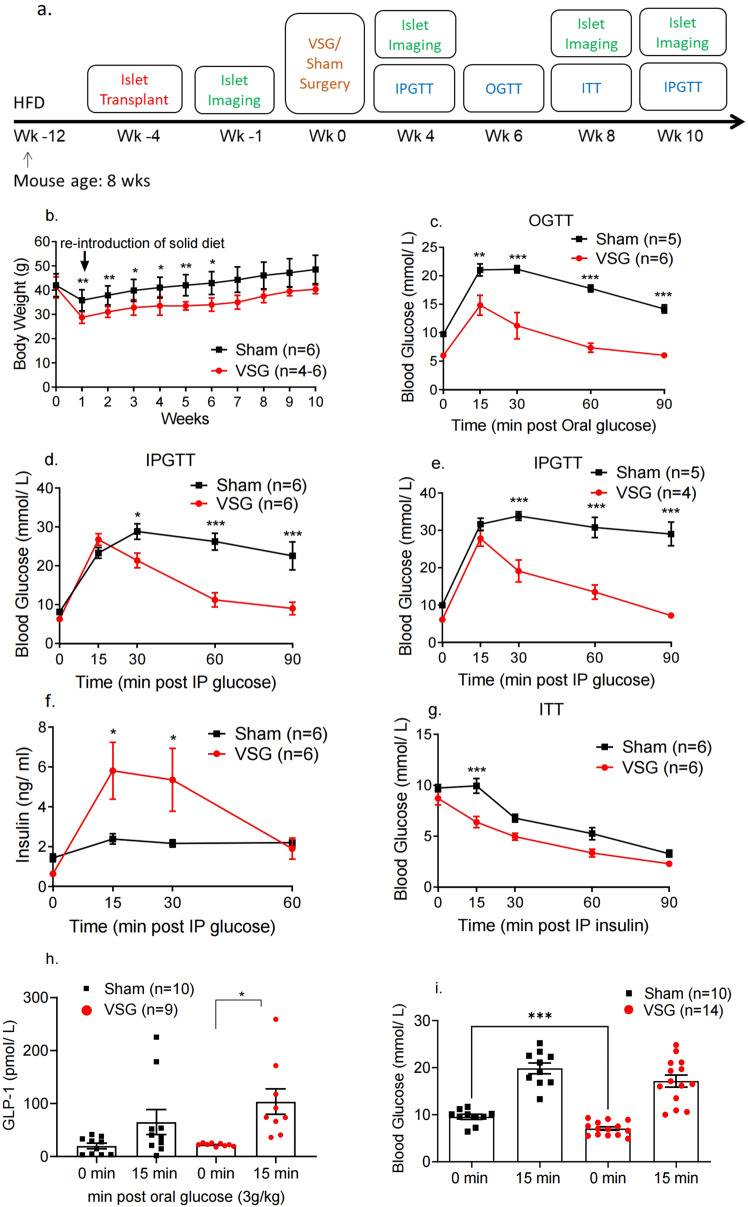
Fig. 1. VSG improves glucose and insulin tolerance in HFHSD mice.
a Timeline of procedures. b Body weight monitoring following VSG (red, n = 6 until week 6, then n = 4 animals) or sham surgery (black, n = 6 animals) (week 1: p = 0.006, week 2: p = 0.008, week 3: p = 0.02, week 4: p = 0.02, week 5: p = 0.009, week 6: p = 0.03). c Glucose was administered via oral gavage (3 g/kg) after mice were fasted overnight and blood glucose levels measured at 0, 15, 30, 60 and 90 min post gavage, 6 weeks after surgery, n = 5–6 mice/group. d Glucose was administered via intraperitoneal injection (3 g/kg) after mice were fasted overnight and blood glucose levels measured at 0, 15, 30, 60 and 90 min post injection, 4 weeks after surgery, n = 6 mice/group. P = 0.039 at 30 min, p < 0.001 for other timepoints. e Glucose was administered via intraperitoneal injection (3 g/kg) after mice were fasted overnight and blood glucose levels measured at 0, 15, 30, 60 and 90 min post injection, 10 weeks after surgery, n = 4–5 mice/group. f Corresponding insulin secretion levels measured on plasma samples obtained during the IPGTT performed in d (n = 6 animals), p = 0.015 at 15 min, p = 0.027 at 30 min. g Insulin was administered via intraperitoneal injection (1.5 UI/kg) after mice were fasted for 5 h and blood glucose levels measured at 0, 15, 30, 60 and 90 min post injection, 7–8 weeks after surgery, n = 6 mice/group. h Corresponding GLP-1 secretion levels measured on plasma samples obtained during the OGTT performed in c (n = 9–10). i Corresponding glucose levels for 0, 15 min obtained during the OGTT performed in c (n = 10–14 animals), p = 0.0006. *P < 0.05, **p < 0.01,***p < 0.001 VSG vs. Sham, following two-sided Student’s t-test or two-way ANOVA (adjusted for multiple comparisons). Data are expressed as means ± SEM. VSG vertical sleeve gastrectomy, HFHSD high-fat, high-sugar diet, IPGTT intraperitoneal glucose tolerance test, ITT insulin tolerance test, OGTT oral glucose tolerance test, GLP-1 glucagon-like peptide 1. Source data are provided as a Source Data file.

