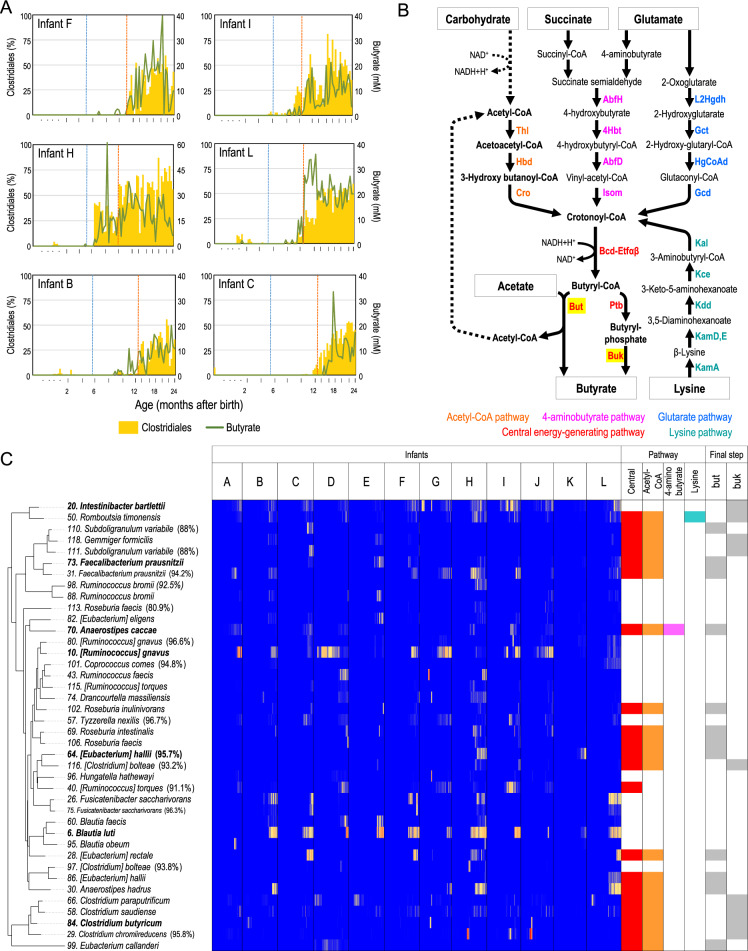
Fig. 4. Clostridiales members contribute to gut butyrate production.
A Plot of Clostridiales abundance and butyrate concentrations with respect to age. Six representative subjects are presented (see Fig. S5A for all subjects). Blue and orange dotted vertical lines represent the initiation of solid food and cessation of breastfeeding, respectively. B Pathway for butyrate production [35]. C Age-dependent heatmap of Clostridiales phylotypes and their potent butyrate production. The top 40 Clostridiales phylotypes are shown. Left tree represents the taxonomic relationship based on 16S rRNA sequences. Right figure is a summary of the presence of genes for butyrate production (see Fig. S6B). Phylotypes mentioned in the text are highlighted in bold.

