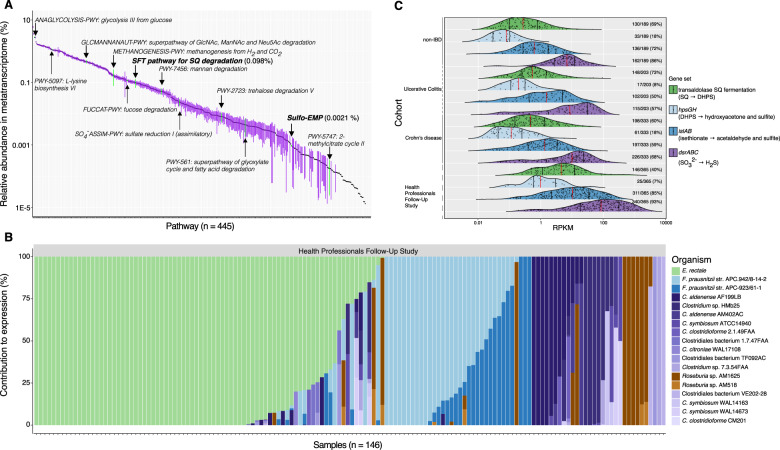
Fig. 3. Expression of microbial pathways for SQ fermentation and H2S production are abundantly and frequently detected in human stool metatranscriptomes.
A Ranked relative abundance of 445 identified pathways in 1,090 human stool metatranscriptomes from 201 individuals; each point is the mean relative abundance of a pathway and error bars correspond to the 95% confidence interval of the mean. B Relative % contribution of various Firmicutes (depicted in various colors) to expression of the SFT pathway in the HPFS cohort (n = 146). Each bar corresponds to one sample. See “Materials and methods” for references. C Expression of the SFT pathway, DHPS and isethionate utilization (hpsGH and islAB, respectively), and sulfite respiration (dsrABC) in 1,090 human stool metatranscriptomes from 201 individuals from 4 cohorts. The height and area of the ridgeline plots correspond to the distribution of expression. Each point corresponds to 1 sample, the red vertical lines depict the median, and the black lines correspond to the 25th and 75th percentiles. The number of samples with detectable expression within each group is indicated to the right of each plot. HPFS Health Professionals Follow-up Study, RPKM reads per kilobase per million reads, SQ sulfoquinovose, DHPS 2,3-dihydroxypropane-1-sulfonate.

