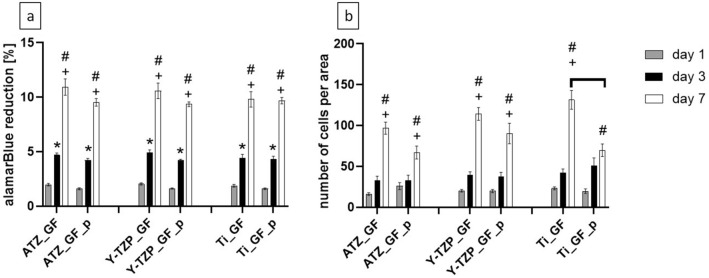
Figure 13.
Metabolic activity (a) and total cell number per area determined by counting the cells on micrographs (b). The percentage of alamarBlue reduction in the supernatant refers to a 100% reduced control. Data are presented as mean values ± SEM (data collected on 6 biomaterial discs). Statistically significant differences between the different biomaterial groups were marked with brackets above the corresponding bars. “*” marks statistically significant differences between day 1 and 3, “+” between day 3 and day 7 and “#” between day 1 and day 7.

