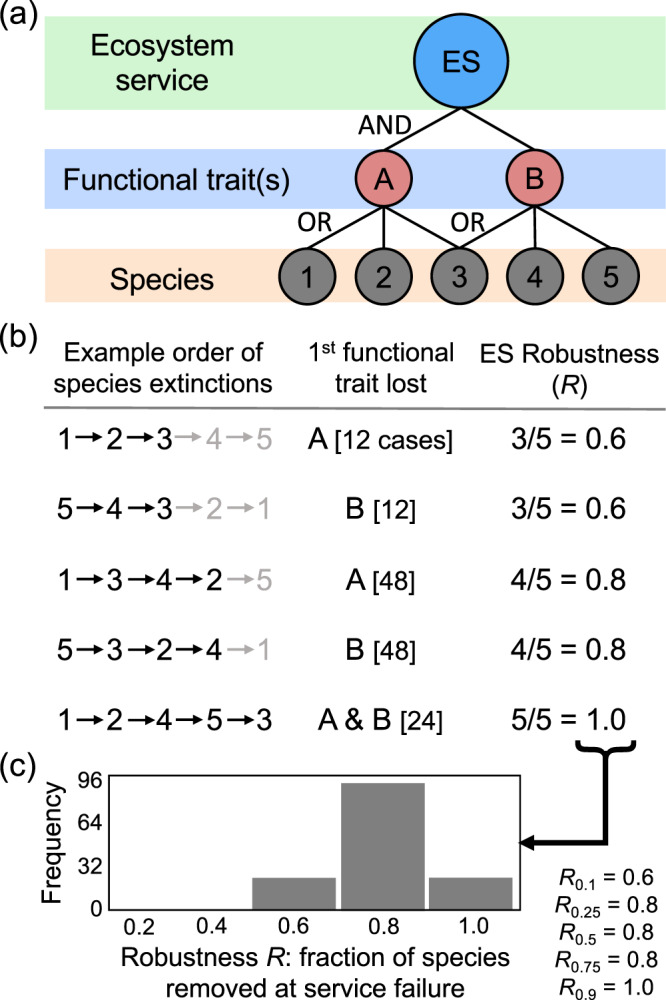
Fig. 1. The principles of our approach to measuring the robustness of ecosystem services to species loss.

a We use a qualitative framework (see ‘Methods’ for a detailed description) whereby species [1–5 in this example] are linked to their functional traits [A and B] and are either present or absent from a community. An ecosystem service [ES] is supplied only when all underpinning functional traits are present in the community (the Boolean function AND; see ‘Methods’ and Supplementary Methods for justification). b As species are removed sequentially from the system, a functional trait is present until all species connected to that trait are lost. In this way, species losses are tolerated (the Boolean function OR) until a unique functional trait has been lost. ‘Example order of species extinctions’ presents illustrative examples of the sequential removal of the species in a, with sequences in grey indicating extinctions after service failure. ‘1st functional trait lost’ is the identity of the unique functional trait [A and/or B] first lost from the system—which, under our framework, necessarily causes service loss—with [n cases] indicating the number of extinction sequences for which this result is obtained [reflected also in the histogram (c)]. We measure ‘ES Robustness (R)’ as the fraction of species removals required to bring about loss of a service for each extinction sequence. c This results in a distribution of robustness R values, representing the fraction of species loss tolerated across all extinction scenarios. This distribution of R values can be described via its percentiles [denoted with subscript c] with, for example, the median robustness [R0.5] here equating to 0.8. That is, in 50% of extinction scenarios in this hypothetical example, 4/5 or fewer species extinctions are required to cause service failure.
