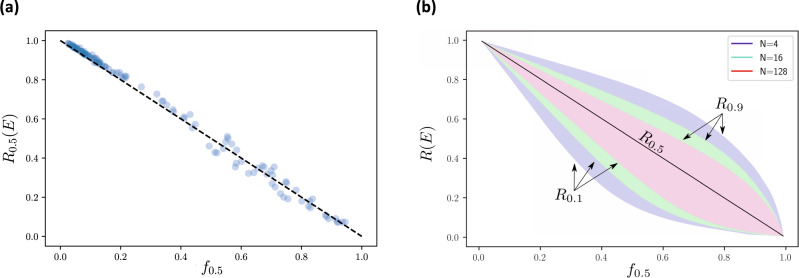
Fig. 3. Universal behaviour of the robustness of ecosystem service supply as a function of network fragility.
a For 125 random ecosystem services of the form shown in Fig. 2, we uniformly sampled 5 values for species richness S between 10 and 200, 20 for functional traits N between 10 and 100 and 10 for connectance p between 0 and 0.5 and for each considered 600 extinction scenarios leading to a loss of service, drawn uniformly over the set of all possible extinction sequences. We see that the median robustness of ecosystem service supply (that is, R0.5(E)) in our simplified Boolean model behaves as a simple decreasing linear function of median network fragility (f0.5). b For three values of number of traits (that is, N = 4, 16 and 128) and random values of number of species S and connectance p, we used the analytical formula in Eq. (1) to draw the contours of the bulk of the robustness distribution (that is, 10th–90th percentiles) as a function of f0.5, the value of fragility associated with median robustness. We see that, at fixed N, the percentiles can be expressed as functions of f0.5, with the largest spread at intermediate values of network fragility. At fixed fragility, increasing the number of traits N reduces the width of the distribution.

