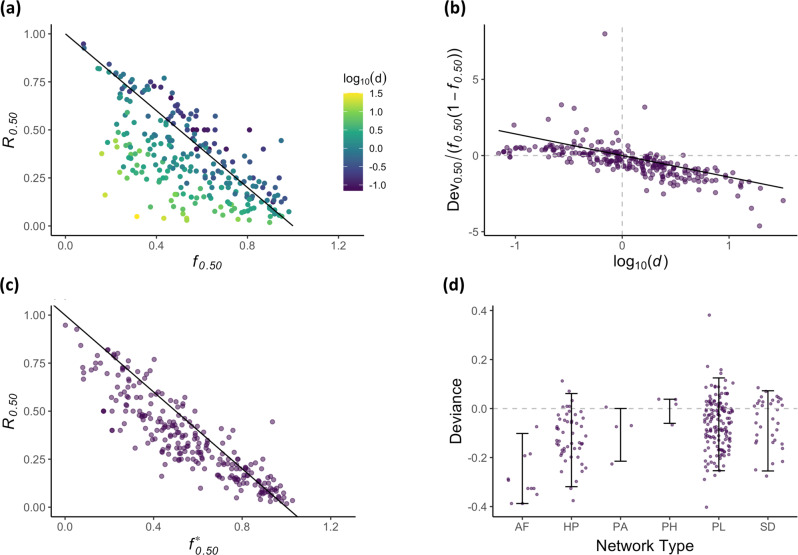
Fig. 4. Robustness of ecosystem service supply and network fragility in empirical networks.
a The relationship between simulated robustness of ecosystem service supply (Rc = R0.5) and analytically estimated network fragility (fc = f0.5) for 251 empirical networks from the Web of Life follows the linear approximation Rc = 1 − fc. Colour indicates network dispersion [log10(d)]. b The residuals off the linear prediction Rc = 1 − fc correlate with log10(d), which we model as (Rc − 1 + fc)/(fc(1 − fc)) = log10(d), where, for the case of R0.5, = −1.42. c Correcting network fragility for dispersion according to log10(d) yields an even closer relationship with robustness of ecosystem service supply. d Residuals from R0.5 − by network type show that our model captures well the universal properties, where AF = anemone–fish (n = 10), HP = host–parasite (n = 51), PA = plant–ant (n = 4), PH = plant–herbivore (n = 4), PL = pollination (n = 148), and SD = seed dispersal (n = 34). Error bars show the 5th and 95th quantiles of the data.

