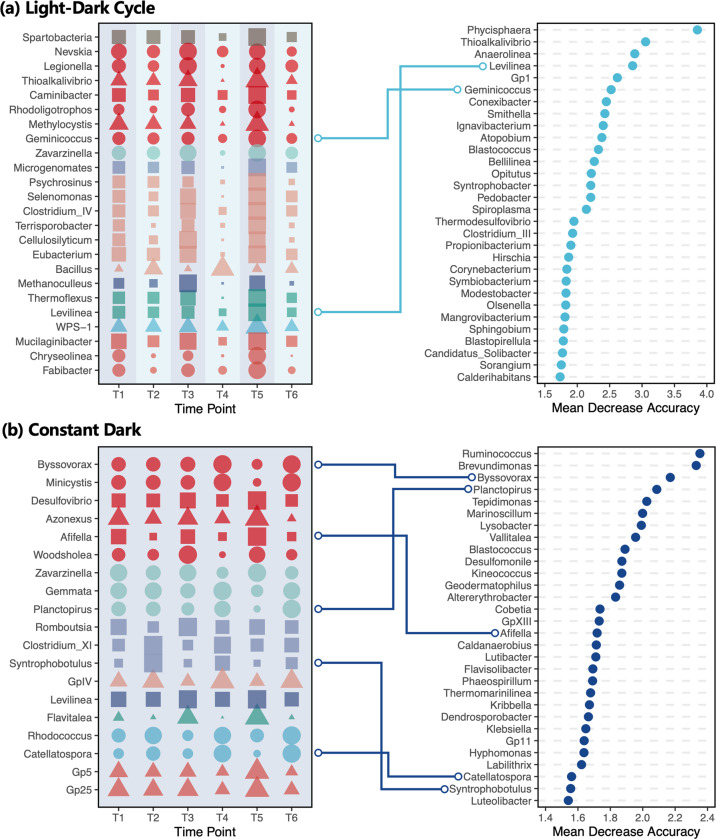
Fig. 3. Rhizosphere microbiota with identified circadian rhythms (left) and the top 30 indicator taxa associated with AM and PM measurements (right).
a Light-dark cycle treatment. b Constant dark treatment. Within the left panel, bubble size indicates normalized abundance of a genus along six time points wherein the population of each genus at each time point was compared to the maximum population of each genera within all time points. Key to bubble shape: square, obligate anaerobic taxa; triangle, anaerobic, or anaerobic taxa; circle, obligate aerobic taxa. Bubble colors represent phyla. Polylines connect genus that are identified as both circadian taxa and indicator taxa.

