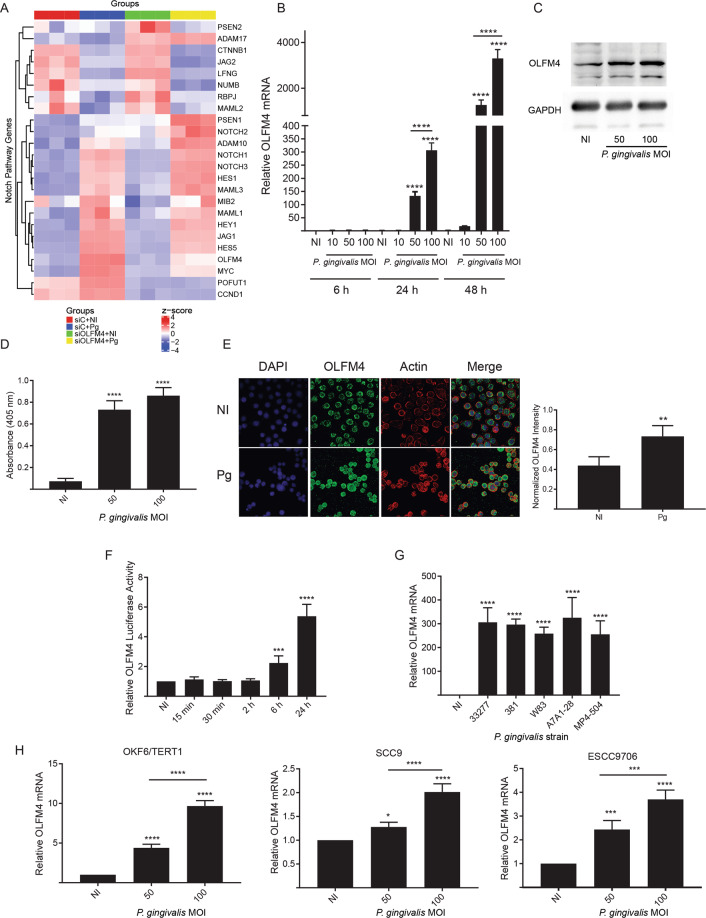
Fig. 1. Responses of TIGKs to P. gingivalis involve the Notch signaling pathway and OLFM4.
A Hierarchical clustering heatmap, based on RNA-Seq log (RPKM) values, of Notch pathway genes differentially regulated by P. gingivalis (Pg) and/or S. gordonii (Sg) challenge in TIGKs. Color intensity denotes level of gene expression by z-score. B qRT-PCR of TIGK cells infected with P. gingivalis at the times and MOIs indicated. OLFM4 mRNA levels are expressed relative to noninfected (NI) controls. C Immunoblot of lysates of TIGK cells challenged with P. gingivalis at MOI 50 or 100 for 24 h, and probed with OLFM4 antibodies or GAPDH antibodies as a loading control. D ELISA of OLFM4 in supernatants of TIGKs challenged with P. gingivalis at indicated MOIs for 24 h. E Fluorescent confocal microscopy of TIGK cells infected with P. gingivalis at MOI 100 for 24 h (Pg) or noninfected (NI). Cells were probed with OLFM4 antibodies and Alexa Fluor 488 secondary antibodies (green). Actin (red) was stained with Texas Red-phalloidin, and nuclei (blue) stained with DAPI. Cells were imaged at magnification ×63, and shown are projections of z-stacks. OLFM4 staining intensity was normalized to DAPI staining and quantified in over 200 cells with Volocity software. F TIGKs were transiently transfected with an OLFM4 promoter–luciferase reporter plasmid, or a constitutively expressing Renilla luciferase reporter. Cells were challenged with P. gingivalis MOI 100 for the times indicated. NI is no infection control. OLFM4 luciferase activity was normalized to the level of Renilla luciferase. G qRT-PCR, as in B, of OLFM4 mRNA levels in TIGKs challenged with the P. gingivalis strains indicated, or left uninfected (NI). H qRT-PCR, as in B, of OLFM4 mRNA levels in the cell types indicated following P. gingivalis challenge. Quantitative data are means with SEM. *p < 0.05, **p < 0.01, ***p < 0.005, ****p < 0.001 compared to NI unless indicated. Images are representative of three independent experiments.

