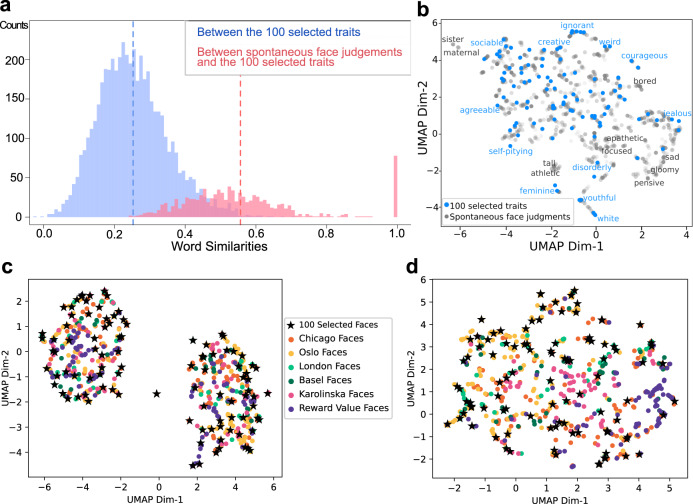
Fig. 2. Representativeness of the sampled traits a–b and face images c–d.
a Distributions of word similarities. The similarity between two words was assessed with the cosine distance between the 300-feature vectors70 of the two words. The blue histogram plots the pairwise similarities among the 100 sampled traits. The red histogram plots the similarities between each of the freely generated words during spontaneous face attributions (n = 973, see Supplementary Fig. 1a) and its closest counterpart in the sampled 100 traits. Dashed lines indicate means. All freely generated words were found to be similar to at least one of the sampled traits (all similarities greater than the mean similarity among the sampled traits [except for the words “moving” and “round”]). Eighty-five freely generated words were identical to those in the 100 sampled traits. b Uniform Manifold Approximation and Projection of words (UMAP75, a dimensionality reduction technique that generalizes to nonlinearities). Blue dots indicate the 100 sampled traits (examples labeled in blue) and gray dots indicate the freely generated words during spontaneous face attributions (see Methods; nonoverlapping examples labeled in gray, which were mostly momentary mental states rather than temporally stable traits). c UMAP of the final sampled 100 faces (stars) compared with a larger set of frontal, neutral, white faces from various databases76–78 (dots, N = 632; see also Supplementary Fig. 1b for comparison with faces in real-world contexts). Each face was represented with 128 facial features as extracted by a state-of-the-art deep neural network74. d UMAP of the final sampled 100 faces (stars) compared with the larger set of faces (dots) as in c. Each face was represented here with 30 automatically measured simple facial metrics72 (e.g., pupillary distance, eye size, nose length, cheekbone prominence). Source data are provided as a Source Data file.

