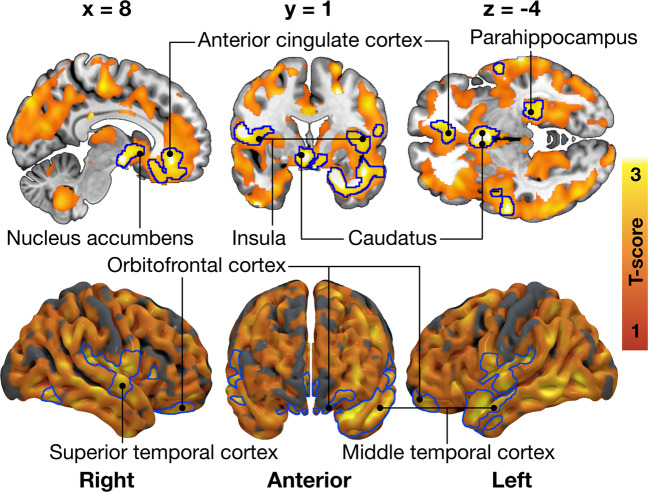
Fig. 4. Total Dutch Eating Behavior Questionnaire (DEBQ) score associated with decreased CB1 receptor availability in the 35 males scanned with [18F]FMPEP-d2.
The blue outline marks brain regions where lower [18F]FMPEP-d2 volume of distribution (VT) associated with higher Total DEBQ score, age as a nuisance covariate, cluster forming threshold p < 0.01, FWE corrected. In the red–yellow T-score scale shown are also additional associations significant with more lenient cluster-defining threshold (p < 0.05, FWE corrected) for visualization purposes.

