Figure 1.
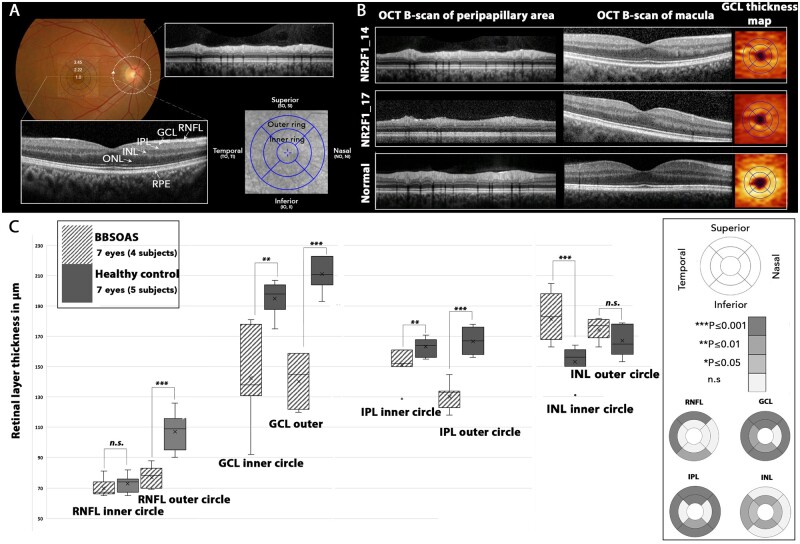
Optical coherence tomography (OCT) composite. (A) Schematic representation of method used to analyse SD-OCT scans (normal eye). Macula grid of central (1.0 mm diameter), inner (2.22 mm diameter) and outer rings (3.45 mm diameter) was centred on the fovea. The 9 sectors in the grid represent the areas where the thickness of the retinal layers (RNFL, GCL, IPL, INL, ONL and RPE) were measured. Circular scan was used to evaluate parapapillary RNFL thickness. The arrow indicates the start position. (B) OCT profiles of two affected individuals and normal control for comparison (single right eye selected). OCT B-scan of the peripapillary area showing preserved RNFL layer. OCT B-scan through the macula showing thinning of the GCL. GCL thickness map indicates thinning of GCL in two affected individuals. (C) Comparison of the thickness of four retinal layers within the inner and outer circles, and in nine sectors for individuals with NR2F1 variants (pattern fill) and normal controls (grey) subjects. The grey scale indicates significant differences in retinal layer thickness between the NR2F1 and control groups. The Mann–Whitney U-test was used to for statistical analysis. *P ≤ 0.05; **P ≤ 0.01; ***P ≤ 0.001; n.s., non-significant. GCL, ganglion cell layer; II, inferior inner; INL, inner nuclear layer; IO, inferior outer; IPL, inner plexiform layer; NI, nasal inner; NO, nasal outer; ONL, outer nuclear layer; RNFL, retinal nerve fibre layer; RPE, retinal pigment epithelium; SI, superior inner; SO, superior outer; TI, temporal inner; TO, temporal outer.

