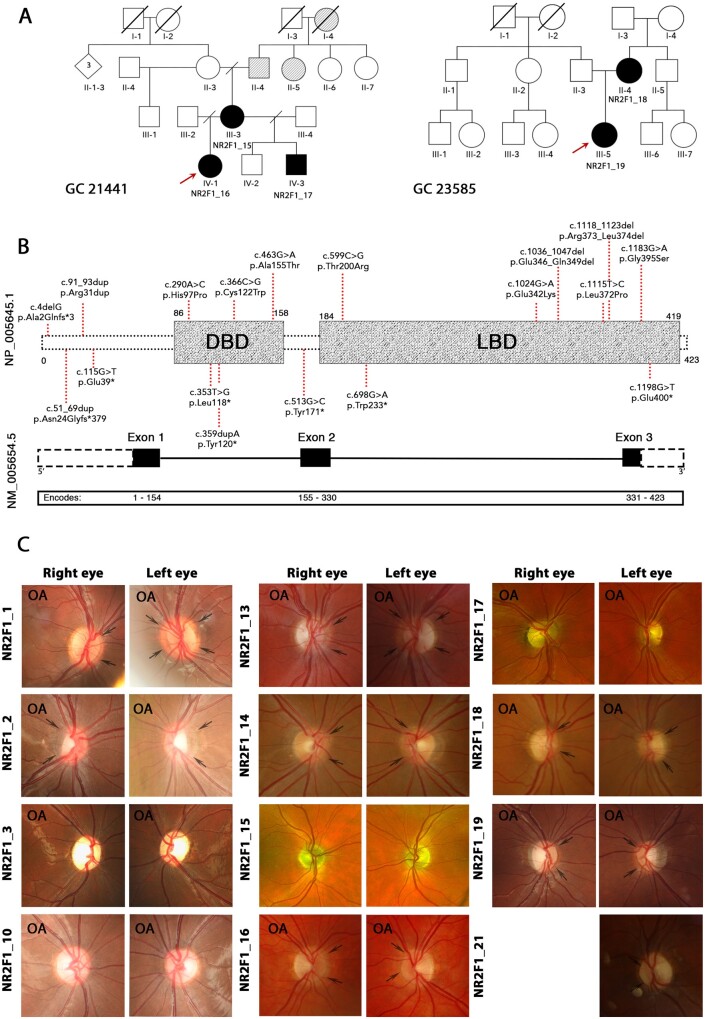
Figure 2.
Genotype spectrum and optic nerve head imaging of study subjects. (A) Pedigrees of familial cases identified in our NR2F1 patient cohort. Red arrows indicate the probands of the two familial cases (GC 21441 and GC 23585). Black shading indicates affected individuals. Grey shading denotes a history of poor vision in family members who have not been assessed formally. (B) Schematic representation of the NR2F1 gene with three exons (black boxes) and the NR2F1 protein structure showing two domains (grey boxes). (C) Colour photographs of the optic nerve heads demonstrating optic atrophy and/or optic nerve hypoplasia. Black arrows highlight the double-ring sign. OA—indicates optic nerve heads with clinical signs of optic atrophy. The locations of the NR2F1 variants identified in our study cohort are indicated in red. DBD, DNA binding domain; LBD, ligand binding domain.

