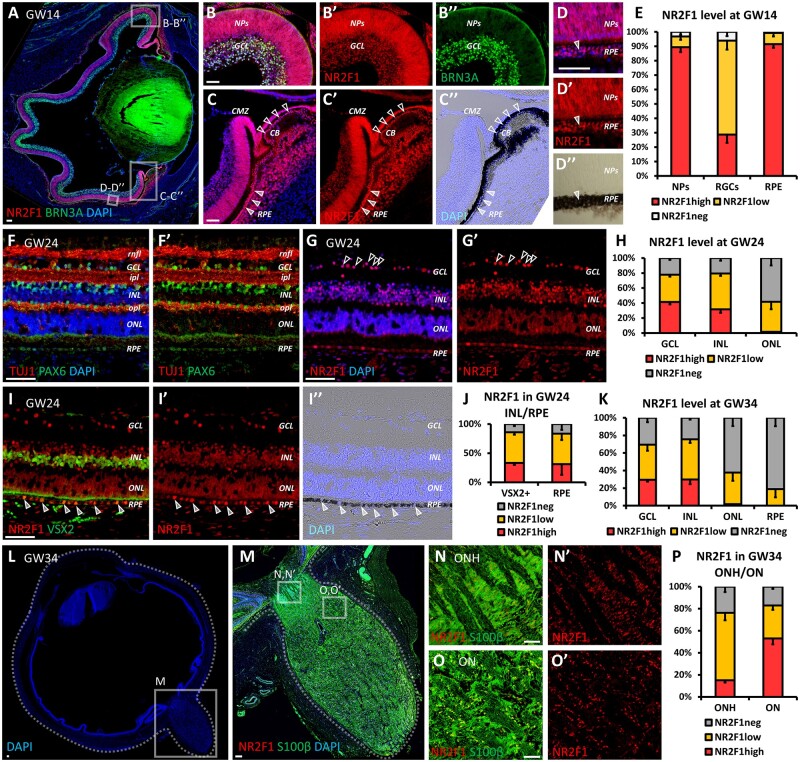
Figure 4.
NR2F1 expression during human retinal development. (A–E) BRN3A (green; RGCs) and NR2F1 (red) immunofluorescence (IF) on a sagittal section of a human GW14 eye, showing NR2F1 expression in almost all NR progenitors and retinal ganglion cells (NPs and RGCs; B–B″), and in virtually all retinal pigmented epithelial cells (RPE; C–D″). The RPE (black) and the ciliary body (CB) are visible in merged fluorescent/brightfield (empty and full arrowheads, respectively, in C–D″). The percentage of NR2F1-expressing NPs, ganglion cell layer (GCL) cells or RPE cells is shown in graph (E). n ≥ 4/5 retinal regions from n = 1 eye (GW14 human embryo). (F–H) PAX6 (green in F, F′), NR2F1 (red in G, G′) or TUJ1 (red in F, F′) IF on GW24 NR cross-sections. Ganglion cell, inner nuclear and outer nuclear layers (GCL, INL and ONL, respectively) and retinal nerve fibre, inner plexiform and outer plexiform layers (rnfl, ipl and opl, respectively) were identified based on the position of DAPI+ nuclei and double staining of TUJ1/PAX6 (F, F′), which allowed the quantification of NR2F1 levels in different retinal layers (H). n = 4 retinal regions from n = 2 eyes (GW24 human retina). Arrowheads in (G, G′) point to cells in the GCL showing high NR2F1 level. (I–K) IF with VSX2 for bipolar cells or Müller glia cells (green in I) and NR2F1 (red in I, I′) on GW24 human NR. Arrowheads in (I–I″) point to RPE cells expressing high NR2F1. The proportion of VSX2+ cells or RPE cells expressing no, low or high NR2F1 is shown in graph (J). n = 4 retinal regions from n = 2 eyes (GW24 human retina). (K) Histogram showing the percentage of cells in GCL, INL, ONL and RPE expressing either low or high NR2F1 levels in GW34 human retina. n = 10 retinal regions from n = 3/4 eyes (n = 2 GW34 human embryos). (L–P) IF with S100β for astrocytes (green in M, N, O) and NR2F1 (red in M–O′) on a sagittal section of a human GW34 eye showing the optic nerve head (ONH; magnification in N, N′) and a portion of the optic nerve closest to the NR (magnification in O, O′). The proportion of ONH or optic nerve astrocytes expressing no, low or high levels of NR2F1 is shown in graph (P). n = 10 ONH/ON regions from n = 3/4 eyes (n = 2 GW34 human embryos). Nuclei (blue) were stained with DAPI. The data have been represented as mean ± SEM in the graphs. Scale bars: 50 µm, except A, L, M (100 µm). BPs, bipolar cells; CB, ciliary body; CMZ, ciliary marginal zone; GCL, ganglion cell layer; GW, gestational week; INL, inner nuclear layer; ipl, inner plexiform layer; NPs, neural progenitors; NR, neural retina; ON, optic nerve; ONH, optic nerve head; ONL, outer nuclear layer; opl, outer plexiform layer; RGCs, retinal ganglion cells; rnfl, retinal nerve fibre layer; RPE, retinal pigmented epithelium.

