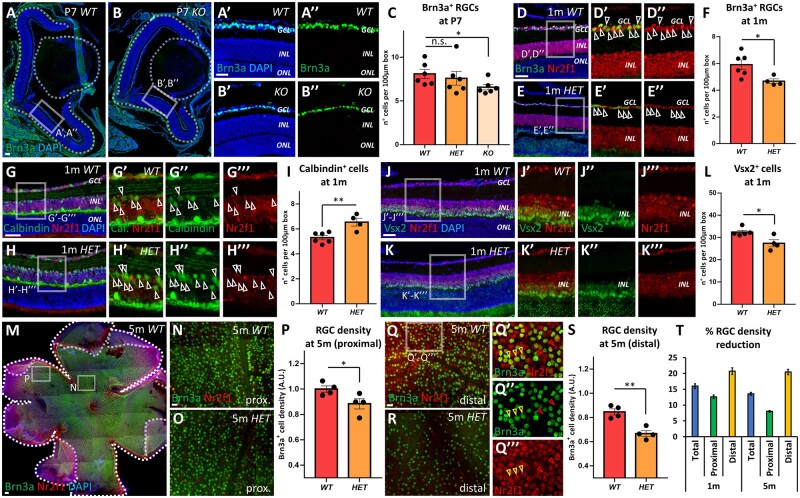
Figure 5.
Altered retinal development secondary to Nr2f1 loss in a mouse model. (A–C) Brn3a (green; RGCs) immunofluorescence (IF) at post-natal (P) day 7 of retina from wild-type (WT; A–A″) and Nr2f1 knock-out mutant (KO; B–B″) mice. Partial (heterozygous; HET) or complete (KO) Nr2f1 loss leads to a reduction in Brn3a+ RGC count (C) [WT/HET: non-significant (n.s.) = 0.1135; WT/KO: * = 0.0325]. (D–F) Brn3a (green; RGCs) and Nr2f1 (red) IF on retina from one-month-old (1 m) WT (D–D″) and mutant HET (E–E″) mice. The arrowheads in (D′–E″) point to double Nr2f1+Brn3a+ RGCs. The retinal density of RGCs is quantified in (F) (WT/HET: * = 0.0195). For a similar quantification performed on 3-months-old retinas, see Supplementary Fig. 4C. (G–I) IF with Calbindin (green) for amacrine and horizontal cells, and Nr2f1 (red) in retina from 1 m-old WT (G–G′″) and mutant HET (H–H′″) mice. The relative density of Calbindin+ cells (ACs) in the INL is shown in (I) (WT/HET: ** = 0.0053). (J–L) IF with Vsx2 (green) for bipolar and Müller glia cells and Nr2f1 (red) in retina from 1 m-old WT (J–J′″) and mutant HET (K–K′″) mice. The density of Vsx2+ cells in INL is shown in (L) (WT/HET: *=0.0187). (M–T) Whole mount IF with Brn3a (green) for RGCs and Nr2f1 (red) in retina from 5-month-old (5 m) WT (M, N and Q–Q′″) and mutant HET (O, R) mice. Yellow arrowheads in (Q′–Q′″) point to double Brn3+Nr2f1+ RGC cells, while red arrowheads highlight Brn3-Nr2f1+ (probably amacrine) cells. The density of Brn3a+ RGCs in proximal or distal retinal regions is shown in (P) and (S), respectively, while quantification on the whole retinal surface is shown in Supplementary Fig. 4N (WT proximal/HET proximal: * = 0.05; WT distal/HET distal: ** = 0.0023). For a similar quantification performed on 1 m-old whole mount retinas, see Supplementary Fig. 4G–M. The percentages of RGC density reduction (ratio between HETRGC density and WTRGC density) in 1 m or 5 m-old retinas and quantified in different regional regions (total, proximal and distal) are shown in Graph (T); a similar trend was found at 1 m and 5 m, suggesting relatively stable RGC reduction during mouse adult lifespan. In graphs (C, F, I, L), the number of positive cells was quantified in 60 µm-width boxes, randomly placed across the NR. In graphs (P, S), the number of Brn3a+ cells was counted within squares of 100 µm-width regions, randomly placed in the central (proximal) or peripheral (distal) regions of flattened whole-mount retinal explants; Brn3a+ cell number was normalized on the average RGC density in 5 m WT retinas (shown in Supplementary Fig. 4M). n ≥ 4/6 eyes from 2/3 animals per genotype, except P and S (n = 4 retinas from n = 2 animals per genotype). The nuclei (blue) were stained with DAPI. The data have been represented as mean ± SEM. The student’s t-test (F, I, L, P and S) and one-way ANOVA (C) were used for statistical analysis (*P < 0.05; **P < 0.01; ***P < 0.001). Scale bars: 50 µm, except A, M (100 µm). 1 m, 1 month-old; 3 m, 3 months-old; A.U., arbitrary unit; AC, amacrine cell; BP, bipolar cell; GCL, ganglion cell layer; INL, inner nuclear layer; NR, neural retina; ONL, outer nuclear layer; RGC, retinal ganglion cell.

