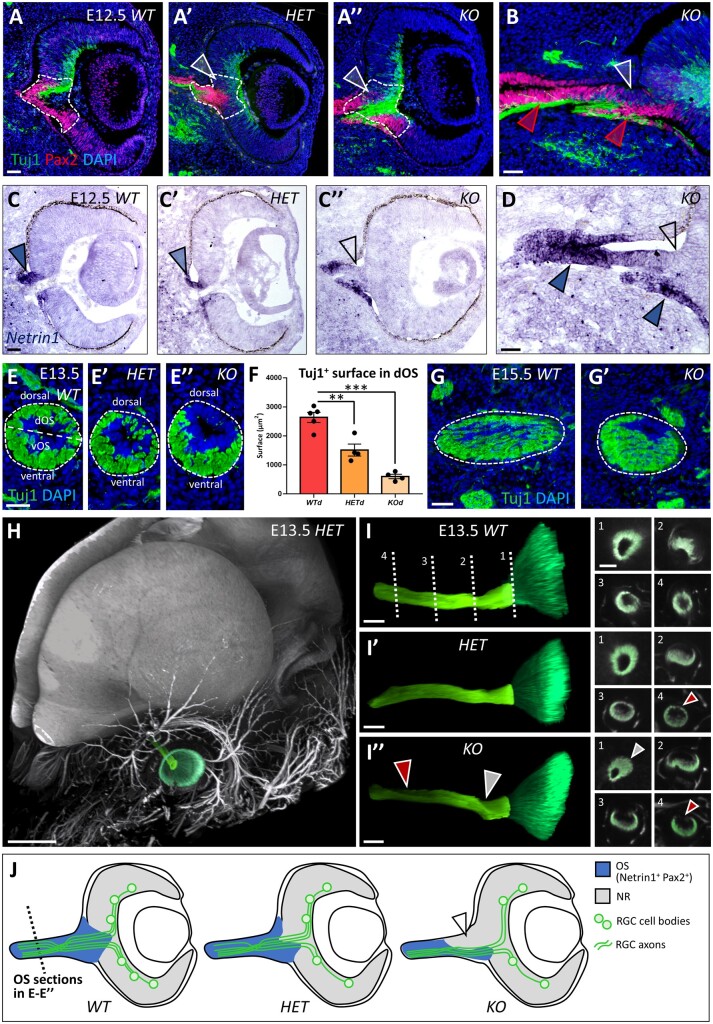
Figure 6.
Altered optic nerve head development and Netrin1-dependent RGC axon guidance secondary to Nr2f1 loss. (A–B) Pax2 (red; presumptive ONH astrocytes at the NR/OS border) and Tuj1 (green; RGC axons) immunofluorescence (IF) of eye cross-sections from wild-type (WT; A), heterozygous (HET; A′) and knock-out mutant (KO; A″ and B) mice at embryonic day (E) 12.5. Partial (HET) or complete (KO) Nr2f1 loss results in decreased number of Pax2+ cells located in the developing optic disc region (delineated area and white arrowheads in A–B). Red arrowheads in (B) indicate the ventral optic stalk (vOS) regions maintaining Pax2 expression. (C–D) In situ hybridization of Netrin1 mRNA in eye cross-sections from E12.5 WT (C), HET (C′) and KO mutant (C″ and D) embryos. A higher magnification picture of the ONH region of a KO embryo is shown in (D). The dorsal optic stalk (dOS) fails to express Netrin1 (empty arrowheads in C″ and D), whereas the vOS regions show abundant Netrin1 expression (blue arrowheads in D). (E–F) Tuj1 IF showing RGC axonal fibres (green) on OS cross-sections of control WT (E), HET (E′) and KO mutant (E″) embryos at E13.5. Most axonal fibres follow a ventral path in KO OS, probably due to the absence of attractive guidance signals, such as Netrin1, in the dorsal-most ONH region. The average surface occupied by Tuj1+ RGC axons in dorsal OS regions is quantified in (F) (WT/HET: ** = <0.0013; WT/KO: *** = <0.0001; HET/KO: ** = 0.0037; n ≥ 4/5 optic stalks from n = 3 embryos per genotype). (G–G′) IF with Tuj1 of RGC axonal fibres (green) on OS cross-sections of control WT (G) and KO mutant (G′) embryos at E15.5, showing persisting decrease of axonal fibres in the dorsal OS of mutant animals. (H) Three-dimensional (3D) imaging of an E13.5 HET embryo head after Tuj1 IF and tissue clearing. A false green colour has been used to highlight the retina and the ON. (I–I″) 3D reconstruction of Tuj1+ axonal fibres exiting the retina (dark green) and entering the OS (light green) in WT (I), HET (I′) and KO (I″) E13.5 embryos. Dotted lines in (I) show the levels of transverse sections (1–4) displayed in the panels on the right. The white arrowheads point to ONH malformation in KO embryos, whereas the red arrowheads highlight reduced Tuj1 staining in the dorsal aspect of the developing ON in both mutant HET and KO embryos. (J) Schematic representation of the developing OS (blue) and NR (grey) in WT, HET and KO mouse eyes. As dorsal optic disc cells lose Netrin1 expression in KO mutants (arrowhead), RGC axons (green) are attracted towards the ventral region of the developing ONH, where some Netrin1 signal is still present; furthermore, RGC axons in mutants fail to invade the dorsal-most half of the developing ON. The nuclei (blue) were stained with DAPI. The data have been represented as mean ± SEM. The one-way ANOVA test was used for statistical analysis (**P < 0.01; ***P < 0.001). Scale bars: 50 µm, except H (300 µm) and G–G″ (100 µm). dOS, dorsal optic stalk; NR, neural retina; ONH, optic nerve head; OS, optic stalk; RGC, retinal ganglion cell; vOS, ventral optic stalk.

