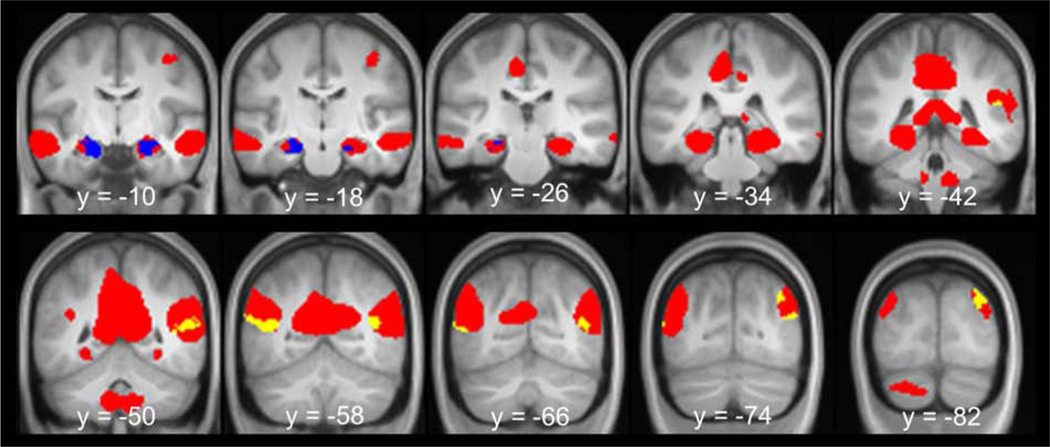
Figure 5.
Results of the parametric modulation analyses. Parametric modulation effects associated with vividness are shown in blue and parametric modulation effects associated with the amount of episodic details are shown in yellow. Shown in red are simulation effects identified with the contrast episodic simulation > non-episodic control contrast (collapsed across vividness and amount of episodic detail). Results are overlaid onto the coronal sections of the across-participants mean T1-weighted anatomical image.

