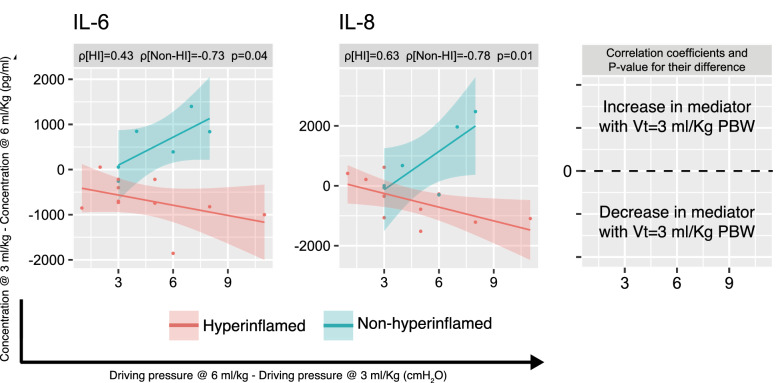
Fig. 4.
Correlation between the change in IL-6 and IL-8 BALF levels from ventilation with 6 ml/kg predicted body weight (PBW) to 3 ml/kg PBW and the corresponding change in driving pressure in hyperinflamed and non-hyperinflamed patients (defined using a threshold in IL-6 levels during ventilation with 6 ml/kg PBW of 680 pg/ml). Note that the x-axis represents the change in driving pressure when tidal volume is decreased, which is mainly defined by compliance of the respiratory system. IL interleukin. P values correspond to the comparison between the two correlation coefficients

