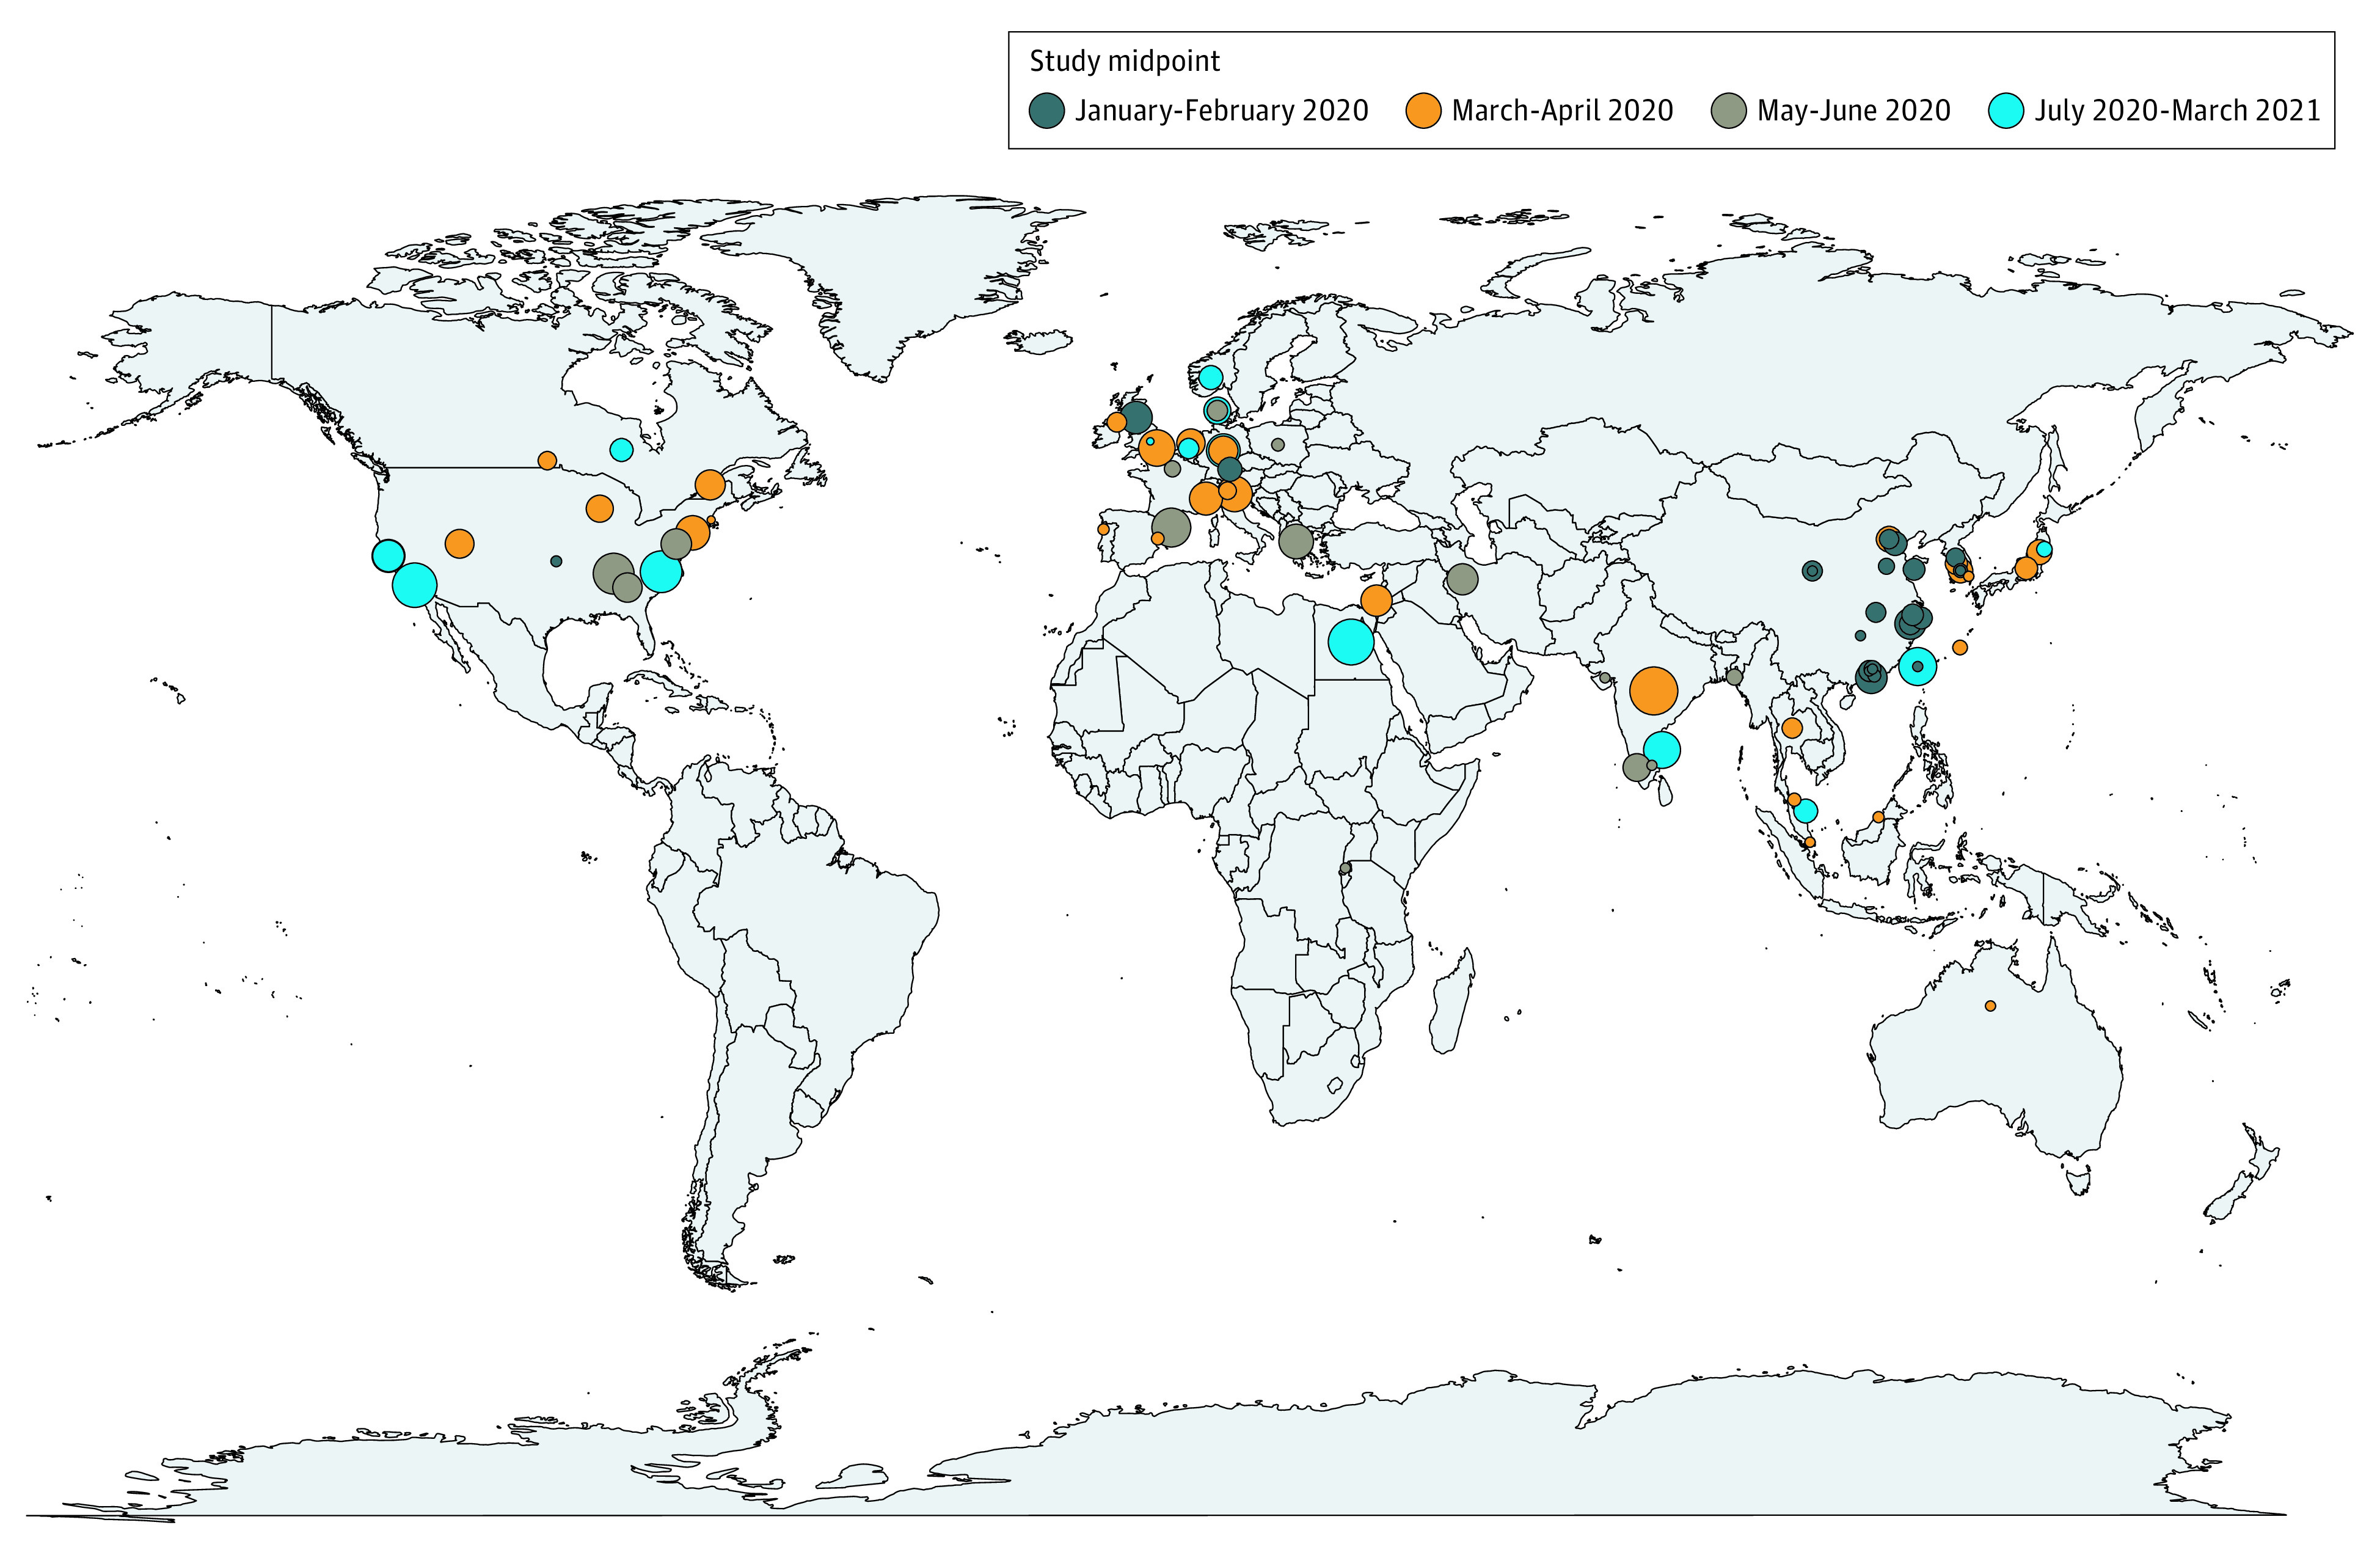
Figure 2. Household Secondary Attack Rates by Study Location.

For studies that included data from multiple regions within a country, a point in the center of the country was selected. Circle sizes represent extent of secondary attack rates, with small circles indicating 0.2, medium circles indicating 0.4, and large circles indicating 0.6.
