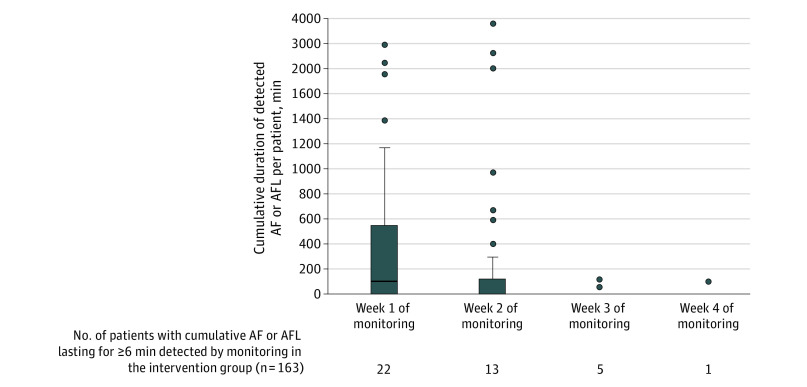
Figure 3. Cumulative Duration of Detected Atrial Fibrillation (AF) or Atrial Flutter (AFL) Episodes (per Patient) Within the First 30 Days of Randomization.
Box and whisker plots of the cumulative duration of detected AF or AFL durations for patients randomized to continuous cardiac rhythm monitoring within the first 30 days of randomization. The upper and lower ends of the box represent the first and third quartile. The line in the box represents the median. In week 2, the median was 0.2 minutes. In week 1, the whisker above the upper quartile is drawn up to the largest observed point that falls within 1.5 times of the interquartile range (IQR). In week 2, the whisker is 1.5 times of the IQR. The whiskers below the lower quartile are not illustrated because they cross zero. Outliers are presented as circles located outside the whiskers. There were 10 patients who had AF lasting 6 minutes or longer in multiple monitoring weeks.

