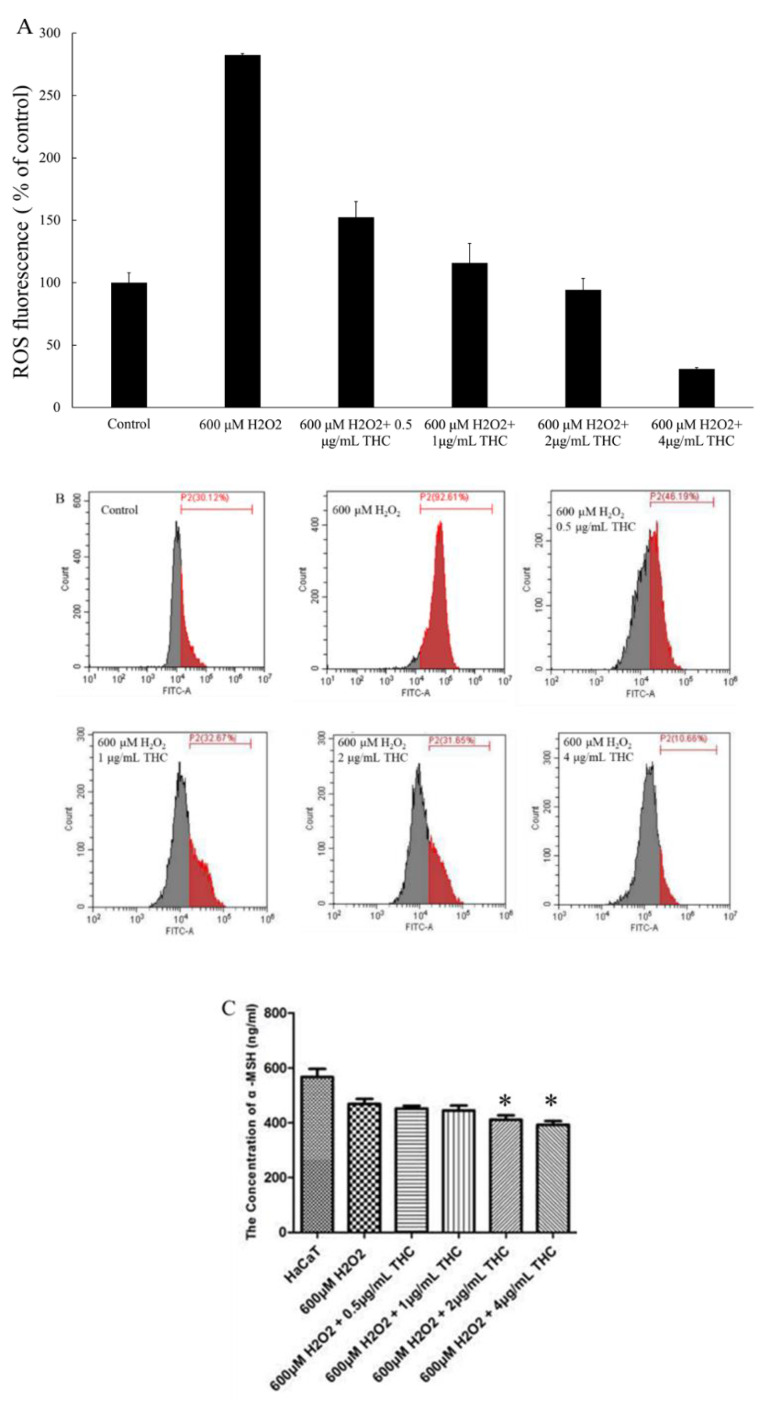
Figure 3.
Protective role of THC on the H2O2 induced ROS levels in HaCaT. (A) The summary of ROS levels in HaCaT cells (B) Intracellular ROS levels of HaCaT were assessed by flow cytometry. (C) α-MSH levels were found in the supernatant in HaCaT, after the cells were pretreated without or with the selected concentrations of THC (0.5, 1, 2, and 4 μg/mL) for 12 h prior to the addition of H2O2. Results are expressed as mean SD (n = 3). * p < 0.05 compared to the cells treated with 600 μM H2O2 only.

