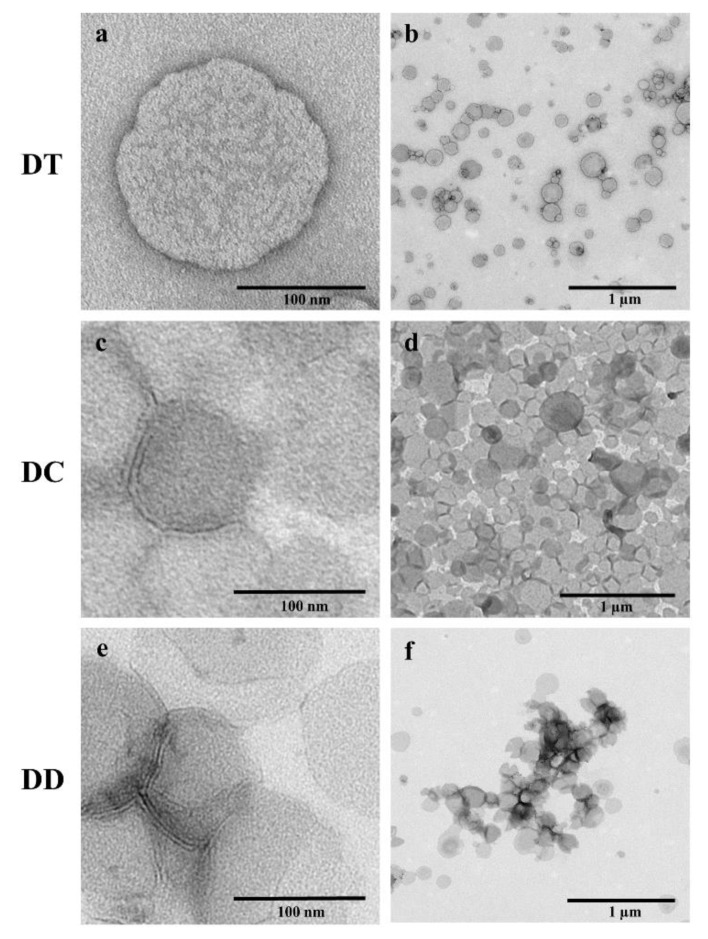
Figure 4.
Transmission electron microscope (TEM) images of the liposomal formulations DT, DC and DD after nebulisation, containing a curcumin concentration of 100 µM. The samples were negatively stained with 2% uranyl acetate. Scale bars represent 100 nm for the images (a,c,e) and 1 µm for the images (b,d,f).

