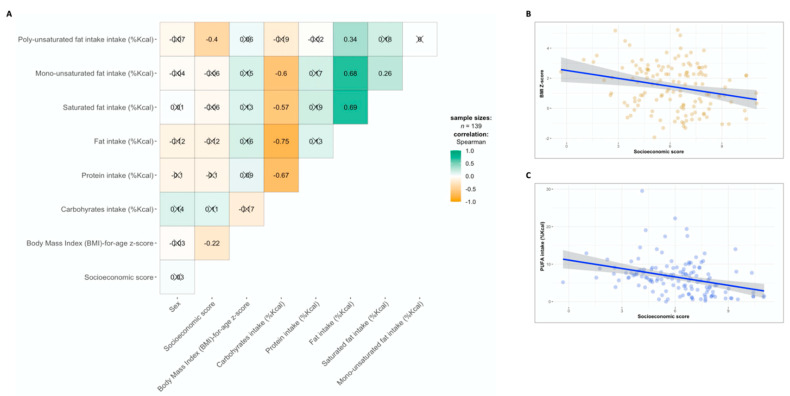
Figure 1.
Socio-demographic characteristics and dietary intake (A) Correlation matrix of Spearman’s correlation coefficients across the study variables. Positive correlations are colored in green and inverse correlations are colored in orange. (B) A scatter plot of the correlation between BMIZ score and SES score. (C) A scatter plot of the correlation between intake of PUFAs (%Kcal) and SES score. X in the figure represents non-significant correlation (p > 0.05 adjusted for FDR).

