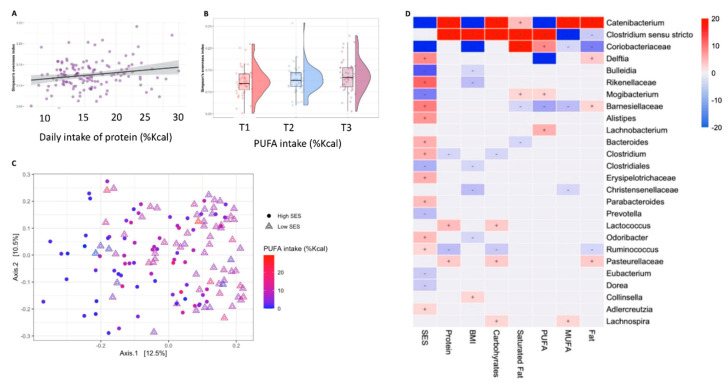
Figure 2.
Bacterial diversity and composition. (A) A scatter plot of the correlation between alpha diversity, evaluated by Simpson’s evenness index, increased and intake of protein (%Kcal/day). (B) Box plot of alpha diversity, evaluated by Simpson’s evenness index according to tertiles consumption of PUFAs (%Kcal/day) (T1 = lowest tertile, T2 =middle tertile, T3 = upper tertile). (C) Principal component analysis (PcoA) of the Unweighted UniFrac distance showing a significant separation based on the SES score and intake of PUFAs. (D) A heatmap of the multivariable model describing the top 50 associations between the independent variables and bacterial features. Positive associations are colored in red, while inverse associations are colored in blue. The color gradient represents the strength of the association (the effect size), with darker colors representing the stronger associations. The effect size was calculated by the following formula: (−log(qval)*SIGN (coeff)).

