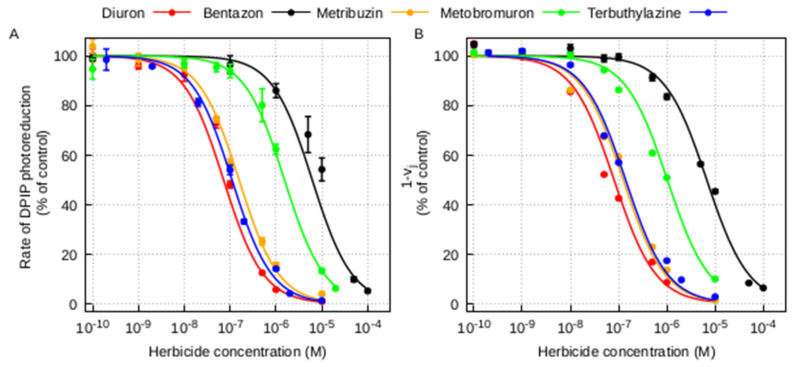
Figure 2.
Photochemical and fluorescence assays of Photosystem II inhibition in pea thylakoid membranes by different photosynthetic herbicides. (A) Inhibition of DPIP photoreduction. Points are mean of at least three measurements, bars are standard errors. The experimental points were fitted using the Langmuir adsorption isotherm (R2 = 0.982, R2 = 0.960, R2 = 0.996, R2 = 0.994, R2 = 0.997 for the fitted inhibition curves with diuron, bentazon, metribuzin, metobromuron and terbuthylazine, respectively). (B) Inhibition of the variable fluorescence 1-Vj calculated from corresponding OJIP fluorescence transients. Points are mean of at least four measurements, bars are standard errors. The experimental points were fitted using the Langmuir adsorption isotherm (R2 = 0.989, R2 = 0.994, R2 = 0.993, R2 = 0.991, R2 = 0.993 for the fitted OJIP curves with diuron, bentazon, metribuzin, metobromuron and terbuthylazine, respectively). All the fittings were performed according to [35].

