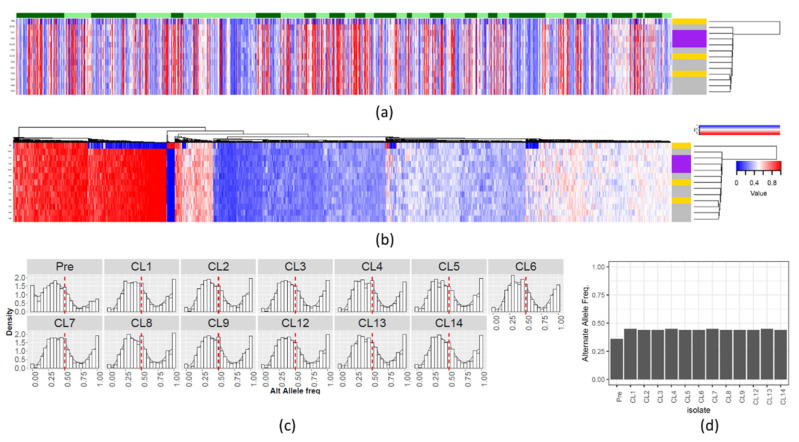
Figure 2.
SNVs alternate allele frequency variability. Alternate allele frequency of each SNV position in the L donovani clones and preselection population. (a) SNVs ordered by chromosome position. The columns and lines correspond respectively to SNV positions and the various L donovani clones. The allele frequency of the alternate allele is represented in a scale from blue (low) to red (high). The dendrogram on the right represents the UPGMA clustering of the Manhattan distance of the alternate allele frequencies. The color strip beside the dendrogram represents the PMM resistance phenotype, where RI < 2, 2 > RI > 5 and RI > 5 are represented respectively, in yellow, grey and purple. The order of the isolates, from top to bottom, is: “preselection”, “CL 12”,“CL 1”,“CL 8”,“CL 13”,“CL 2”,“CL 14”,“CL 5”,“CL 7”,“CL 6”,“CL 4”,“CL 9” and “CL 13”. The alternating light/dark green color strip on the top represents the chromosomes 1–36. (b) The SNVs columns were reordered by UPGMA clustering of the Manhattan distance, instead of being ordered by chromosome position. (c) Genome-wide density plot of the alternate allele frequency distribution of SNVs in the 12 clones and the preselection population. The X and Y axis represent, respectively, the alternate allele frequency (from 0 to 1) and the allele frequency rate. The red dashed line represents an alternate allele frequency of 0.5, the expected value for disomic chromosomes. The observed distribution is suggestive of triploidy. (d) Median genome-wide allele frequency for each clone and the preselection population (Pre).

