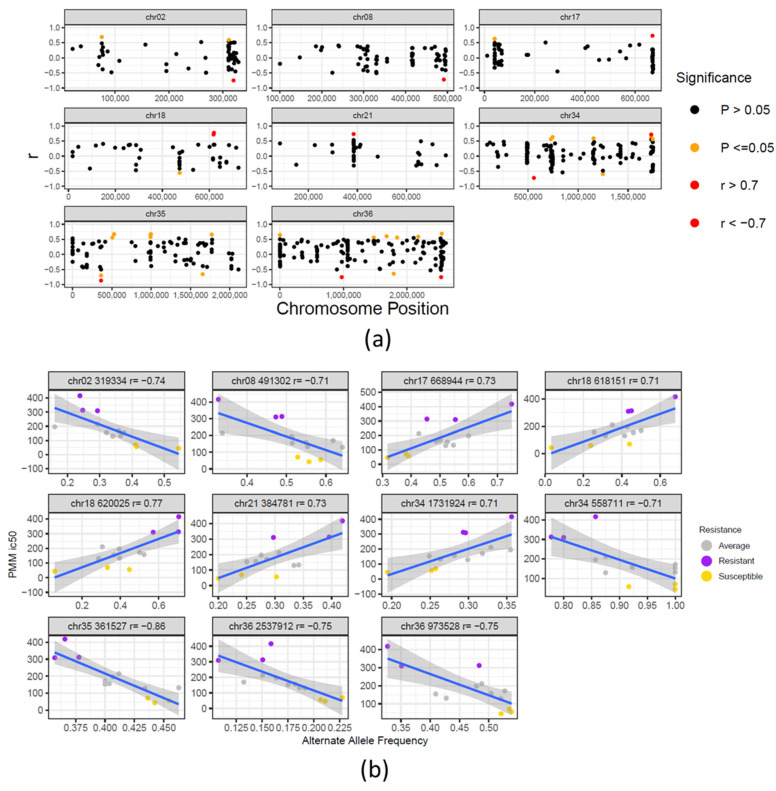
Figure 3.
Correlation between SNVs and PMM resistance: (a) Chromosomal distribution and correlation of SNV allele frequency and PMM resistance. The X and Y axis correspond, respectively, to the chromosome position of each SNV and its correlation to the PMM resistance phenotype. Significant correlations are represented by orange dots. SNVs with strong significant positive or negative correlations (correlation coefficients r ≥ 0.7 and r ≤ −0.7) are represented by red dots. (b) Pearson correlation plots of the 11 significant SNVs with strong correlation to PMM resistance. The box title contains the SNV chromosome, position and correlation, r. The color of the dots reflects the level of resistance of the individual clones to PMM, where yellow, grey and purple correspond respectively to RI < 2, 2 < RI < 5 and RI > 5.

