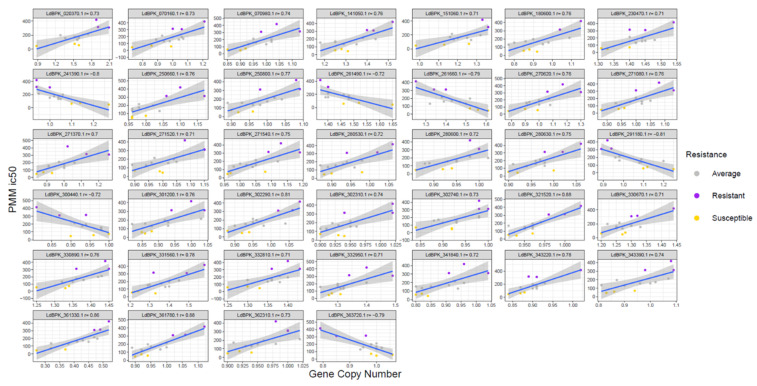
Figure 4.
Correlation between gene CNVs and PMM resistance. Pearson correlation plots of the 39 significant genes with strong correlations to PMM resistance. The title for each box contains the TriTrypDB gene ID and r correlation. The color of the dots reflects the clone’s resistance to PMM, where yellow, grey and purple correspond respectively to RI < 2, 2 < RI < 5 and RI > 5.

