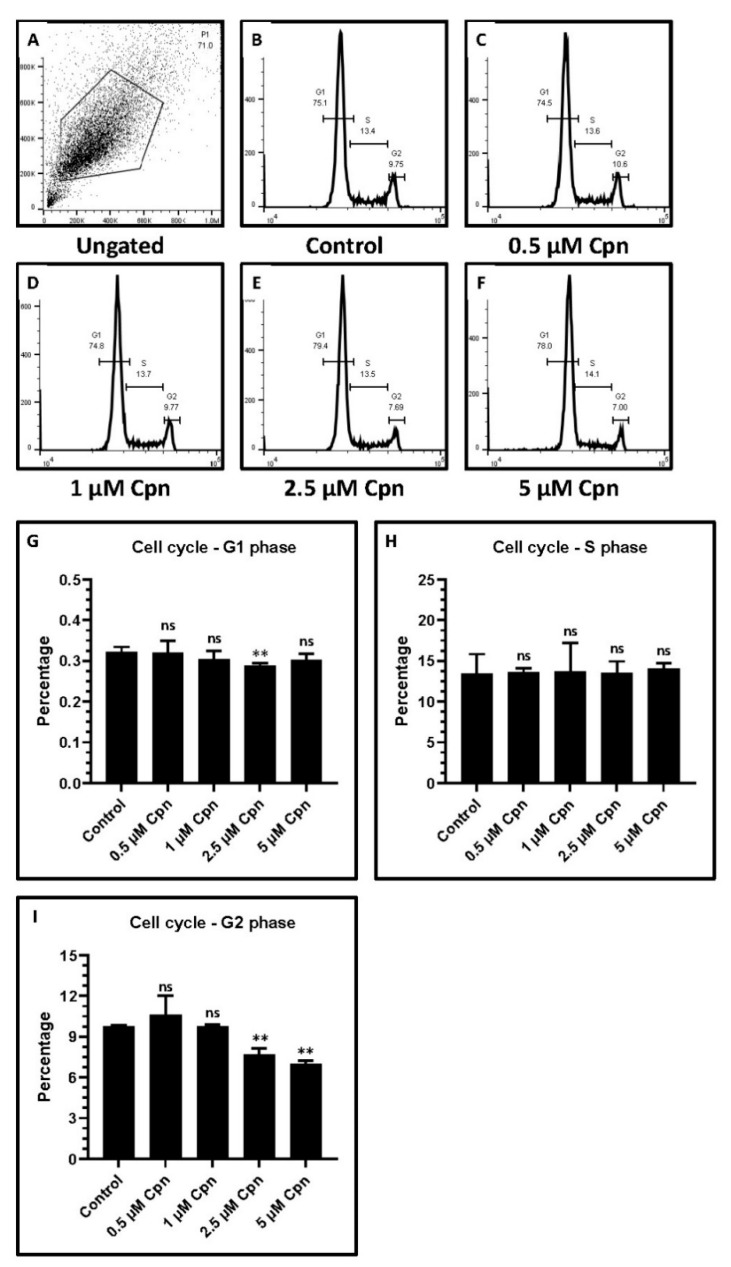
Figure 3.
Cell cycle analysis of DPSCs treated with various concentrations of Cordycepin (0.5 μM, 1 μM, 2.5 μM, and 5 μM). (A–F) Cell cycle analysis. (G) Comparative analysis of G1 phase cells. (H) Comparative analysis of G2 phase cells. (I) Comparative analysis of S phase cells. ns not significant, ** p < 0.01. Cpn: Cordycepin.

