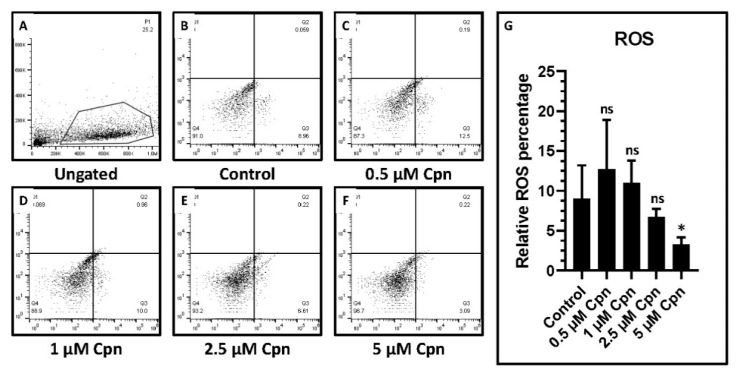
Figure 5.
Analysis of ROS in DPSCs treated with various concentrations of Cordycepin (0.5 μM, 1 μM, 2.5 μM, and 5 μM) for a prolonged time of 7 days. (A–F) ROS analysis. (G) Comparative analysis of relative ROS percentage. ns not significant, * p < 0.05, Cpn: Cordycepin, ROS: Reactive oxygen species.

